For the complete documentation index, see llms.txt. Markdown versions of all docs pages are available by appending .md to any docs URL.
Verify mutual TLS is enabled
Verify that mTLS is active between workloads in ambient mesh using ztunnel config, traffic inspection, or ztunnel logs.
Ambient mesh automatically secures workload communication with mTLS as soon as workloads are added to the mesh. No additional configuration is required.
Use any of the following methods to verify that traffic is secured.
ztunnel config
Run istioctl ztunnel-config workloads to view whether each workload is configured to send and receive HBONE traffic.
istioctl ztunnel-config workloadsPods configured with the HBONE protocol are enrolled in the mesh and communicate over mTLS. The kubernetes pod in this example is not enrolled and uses plain TCP.
NAMESPACE    POD NAME                                IP         NODE                     WAYPOINT PROTOCOL
default      details-v1-857849f66-ft8wx              10.42.0.5  k3d-k3s-default-agent-0  None     HBONE
default      kubernetes                              172.20.0.3                          None     TCP
default      productpage-v1-c5b7f7dbc-hlhpd          10.42.0.8  k3d-k3s-default-agent-0  None     HBONE
default      ratings-v1-68d5f5486b-b5sbj             10.42.0.6  k3d-k3s-default-agent-0  None     HBONE
default      reviews-v1-7dc5fc4b46-ndrq9             10.42.1.5  k3d-k3s-default-agent-1  None     HBONE
default      reviews-v2-6cf45d556b-4k4md             10.42.0.7  k3d-k3s-default-agent-0  None     HBONE
default      reviews-v3-86cb7d97f8-zxzl4             10.42.1.6  k3d-k3s-default-agent-1  None     HBONE
Note
HBONE indicates the workload is configured to use mTLS, but does not mean it rejects plaintext connections. To reject plaintext traffic, create a PeerAuthentication policy with mTLS mode set to STRICT.
Prometheus metrics
-
Open the Prometheus UI.
istioctl dashboard prometheus -
Select Graph.
-
Enter any of the following metrics, and click Execute.
istio_tcp_connections_opened_totalistio_tcp_connections_closed_totalistio_tcp_received_bytes_totalistio_tcp_sent_bytes_total
-
In the results, confirm that the
connection_security_policylabel is set tomutual_tls, and that thesource_principalanddestination_principalvalues match the expected workload identities:istio_tcp_connections_opened_total{ app="ztunnel", connection_security_policy="mutual_tls", destination_principal="spiffe://cluster.local/ns/default/sa/bookinfo-details", destination_service="details.default.svc.cluster.local", reporter="source", request_protocol="tcp", response_flags="-", source_app="curl", source_principal="spiffe://cluster.local/ns/default/sa/curl", source_workload_namespace="default", ...}
ztunnel logs
Check the source or destination ztunnel logs to confirm mTLS is active and that both peer identities are present.
kubectl logs -n istio-system -l app=ztunnelConfirm that src.identity and dst.identity are present and match the expected workload identities. The following example shows the source ztunnel log for a request from curl to the details service.
2024-08-21T15:32:05.754291Z info access connection complete src.addr=10.42.0.9:33772 src.workload="curl-7656cf8794-6lsm4" src.namespace="default"
src.identity="spiffe://cluster.local/ns/default/sa/curl" dst.addr=10.42.0.5:15008 dst.hbone_addr=10.42.0.5:9080 dst.service="details.default.svc.cluster.local"
dst.workload="details-v1-857849f66-ft8wx" dst.namespace="default" dst.identity="spiffe://cluster.local/ns/default/sa/bookinfo-details"
direction="outbound" bytes_sent=84 bytes_recv=358 duration="15ms"
Kiali
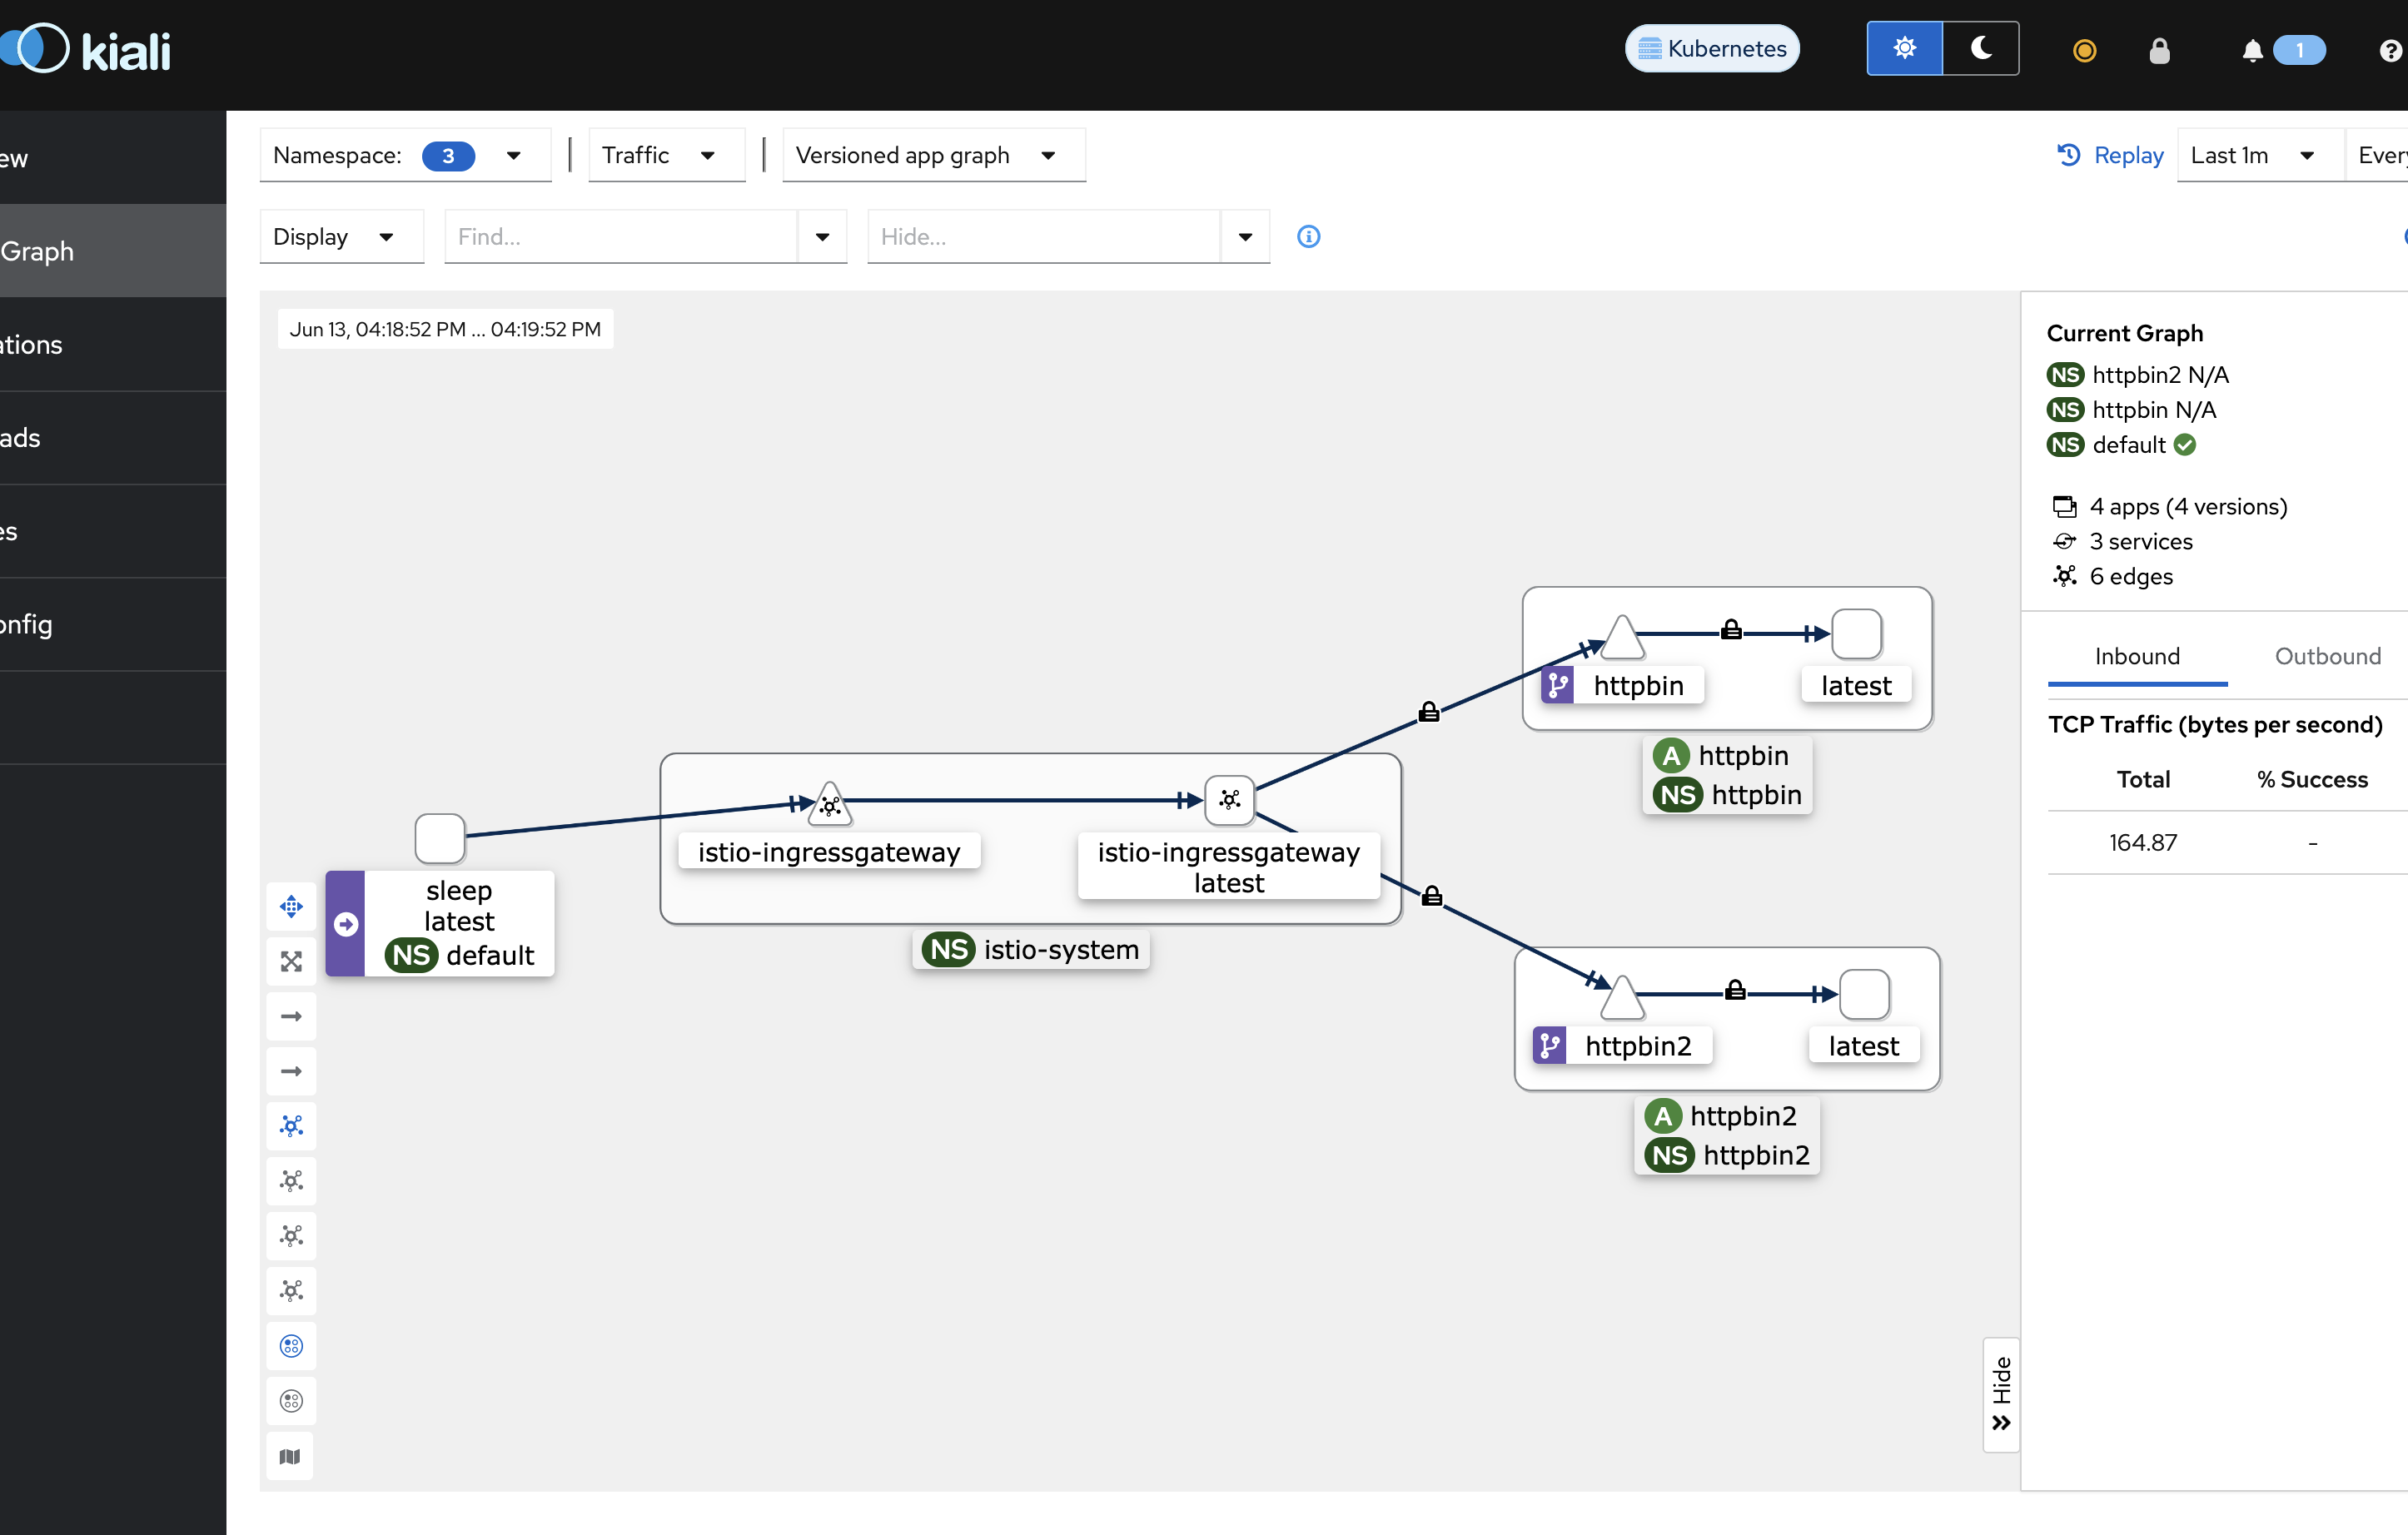
If you have Kiali and Prometheus installed, you can visualize workload communication in ambient mesh using Kiali’s dashboard. A padlock icon on a connection indicates mTLS is enabled, along with peer identity information:
tcpdump
If you have access to your Kubernetes worker nodes, run tcpdump to capture traffic on the network interface. In this example, 9080 is the application port of the details service and 15008 is the HBONE port.
tcpdump -nAi eth0 port 9080 or port 15008If you do not have access to the worker nodes, use the netshoot container image.
POD=$(kubectl get pods -l app=details -o jsonpath="{.items[0].metadata.name}")
kubectl debug $POD -i --image=nicolaka/netshoot -- tcpdump -nAi eth0 port 9080 or port 15008
When mTLS is active, traffic on port 9080 is encapsulated inside the HBONE tunnel on port 15008. In the output, verify that you see traffic on port 15008 with an encrypted, unreadable payload. No plaintext HTTP headers or request body should be visible.