For the complete documentation index, see llms.txt. Markdown versions of all docs pages are available by appending .md to any docs URL.
Configure and view metrics
Configure and view service metrics from ztunnel and waypoint proxies in ambient mesh using Prometheus and Grafana.
Metrics provide a way of monitoring and understanding behavior in aggregate. The two layers of ambient mesh generate different metrics:
- Ztunnel generates TCP metrics for all service traffic
- Waypoint proxies generate request and response metrics for HTTP, HTTP/2, and gRPC traffic.
To monitor service behavior, Istio generates metrics for all service traffic in, out, and within an Istio service mesh. These metrics provide information on behaviors such as the overall volume of traffic, the error rates within the traffic, and the response times for requests.
In addition to monitoring the behavior of services within a mesh, monitoring the behavior of the mesh itself is also important. Istio components export metrics on their own internal behaviors to provide insight on the health and function of the mesh control plane.
Metric sources
Istio provides a set of service-oriented metrics for monitoring service communications. These metrics cover the four basic service monitoring needs: latency, traffic, errors, and saturation.
Each proxy generates a rich set of metrics about all traffic passing through the proxy (both inbound and outbound). The proxies also provide detailed statistics about the administrative functions of the proxy itself, including configuration and health information.
Metrics are accessible by making an HTTP request to either /stats/prometheus or /metrics on port 15020.
Istio proxies are marked up with prometheus.io annotations, which causes Prometheus to scrape them by default.
Install Prometheus
Managing a production-scale monitoring stack is a skill in and of itself. Ambient mesh works with any Prometheus-compatible observability stack, including the Prometheus Operator and commercial offerings. Istio provides a demo installation of Prometheus for learning about how to observe your mesh.
Warning
The demo Prometheus installation provided by Istio should only be used for experimentation. It does not retain metrics, and it introduces extra labels which require a large amount of storage.
kubectl apply -f https://raw.githubusercontent.com/istio/istio/1.30.0/samples/addons/prometheus.yamlQuery and graph metrics with Prometheus
If you installed Prometheus with the Istio add-on, use istioctl to access the Prometheus console:
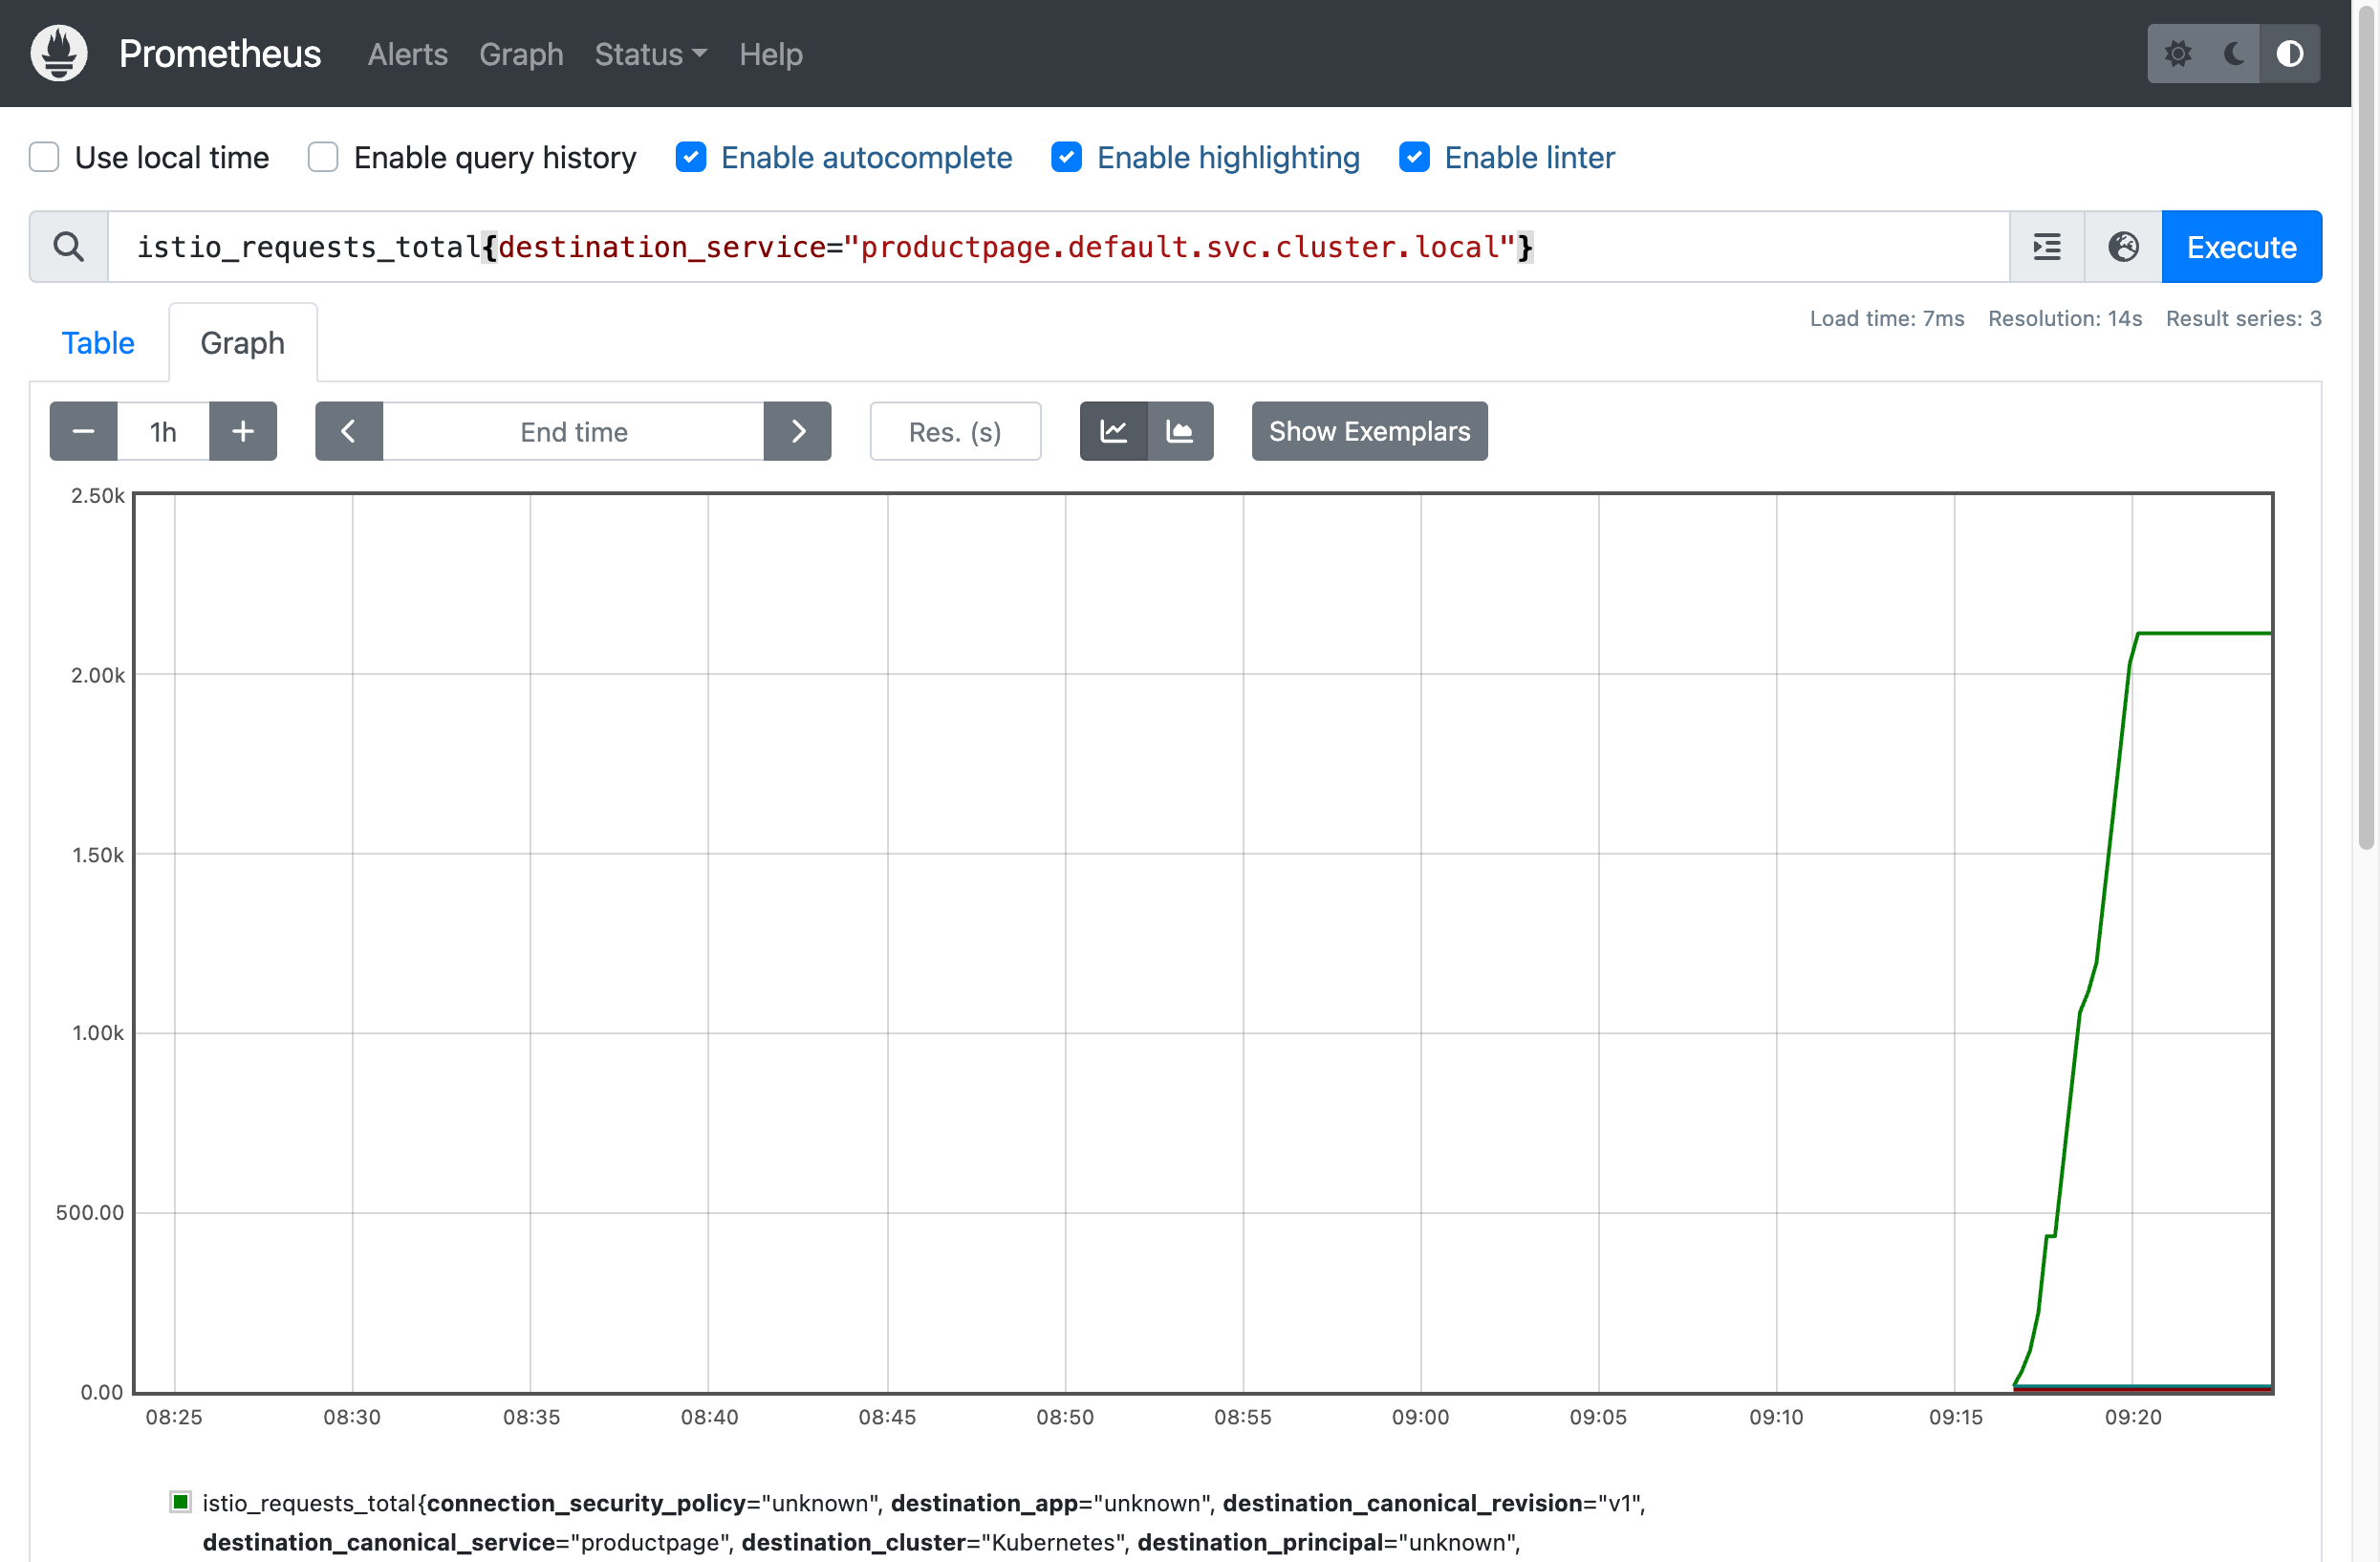
istioctl dashboard prometheusYou can enter queries in the PromQL language. For example:
- Total count of all requests to the
productpageservice:istio_requests_total{destination_service="productpage.default.svc.cluster.local"} - Total count of all requests to
v3of thereviewsservice:istio_requests_total{destination_service="reviews.default.svc.cluster.local", destination_version="v3"} - Rate of requests over the past 5 minutes to all instances of the
productpageservice:rate(istio_requests_total{destination_service=~"productpage.*", response_code="200"}[5m])
View metrics with Grafana
Istio comes with Grafana dashboards which offer summaries of Istio’s metrics, allowing you to drill down by service or workload.
To explore Grafana, use the add-on that comes with Istio:
kubectl apply -f https://raw.githubusercontent.com/istio/istio/1.30.0/samples/addons/grafana.yamlLaunch the dashboard with istioctl:
istioctl dashboard grafanaClick Dashboards in the left-hand menu, then select istio from the list. There are dashboards for control plane, service, workload, and performance, all of which can be copied and customized to your requirements.
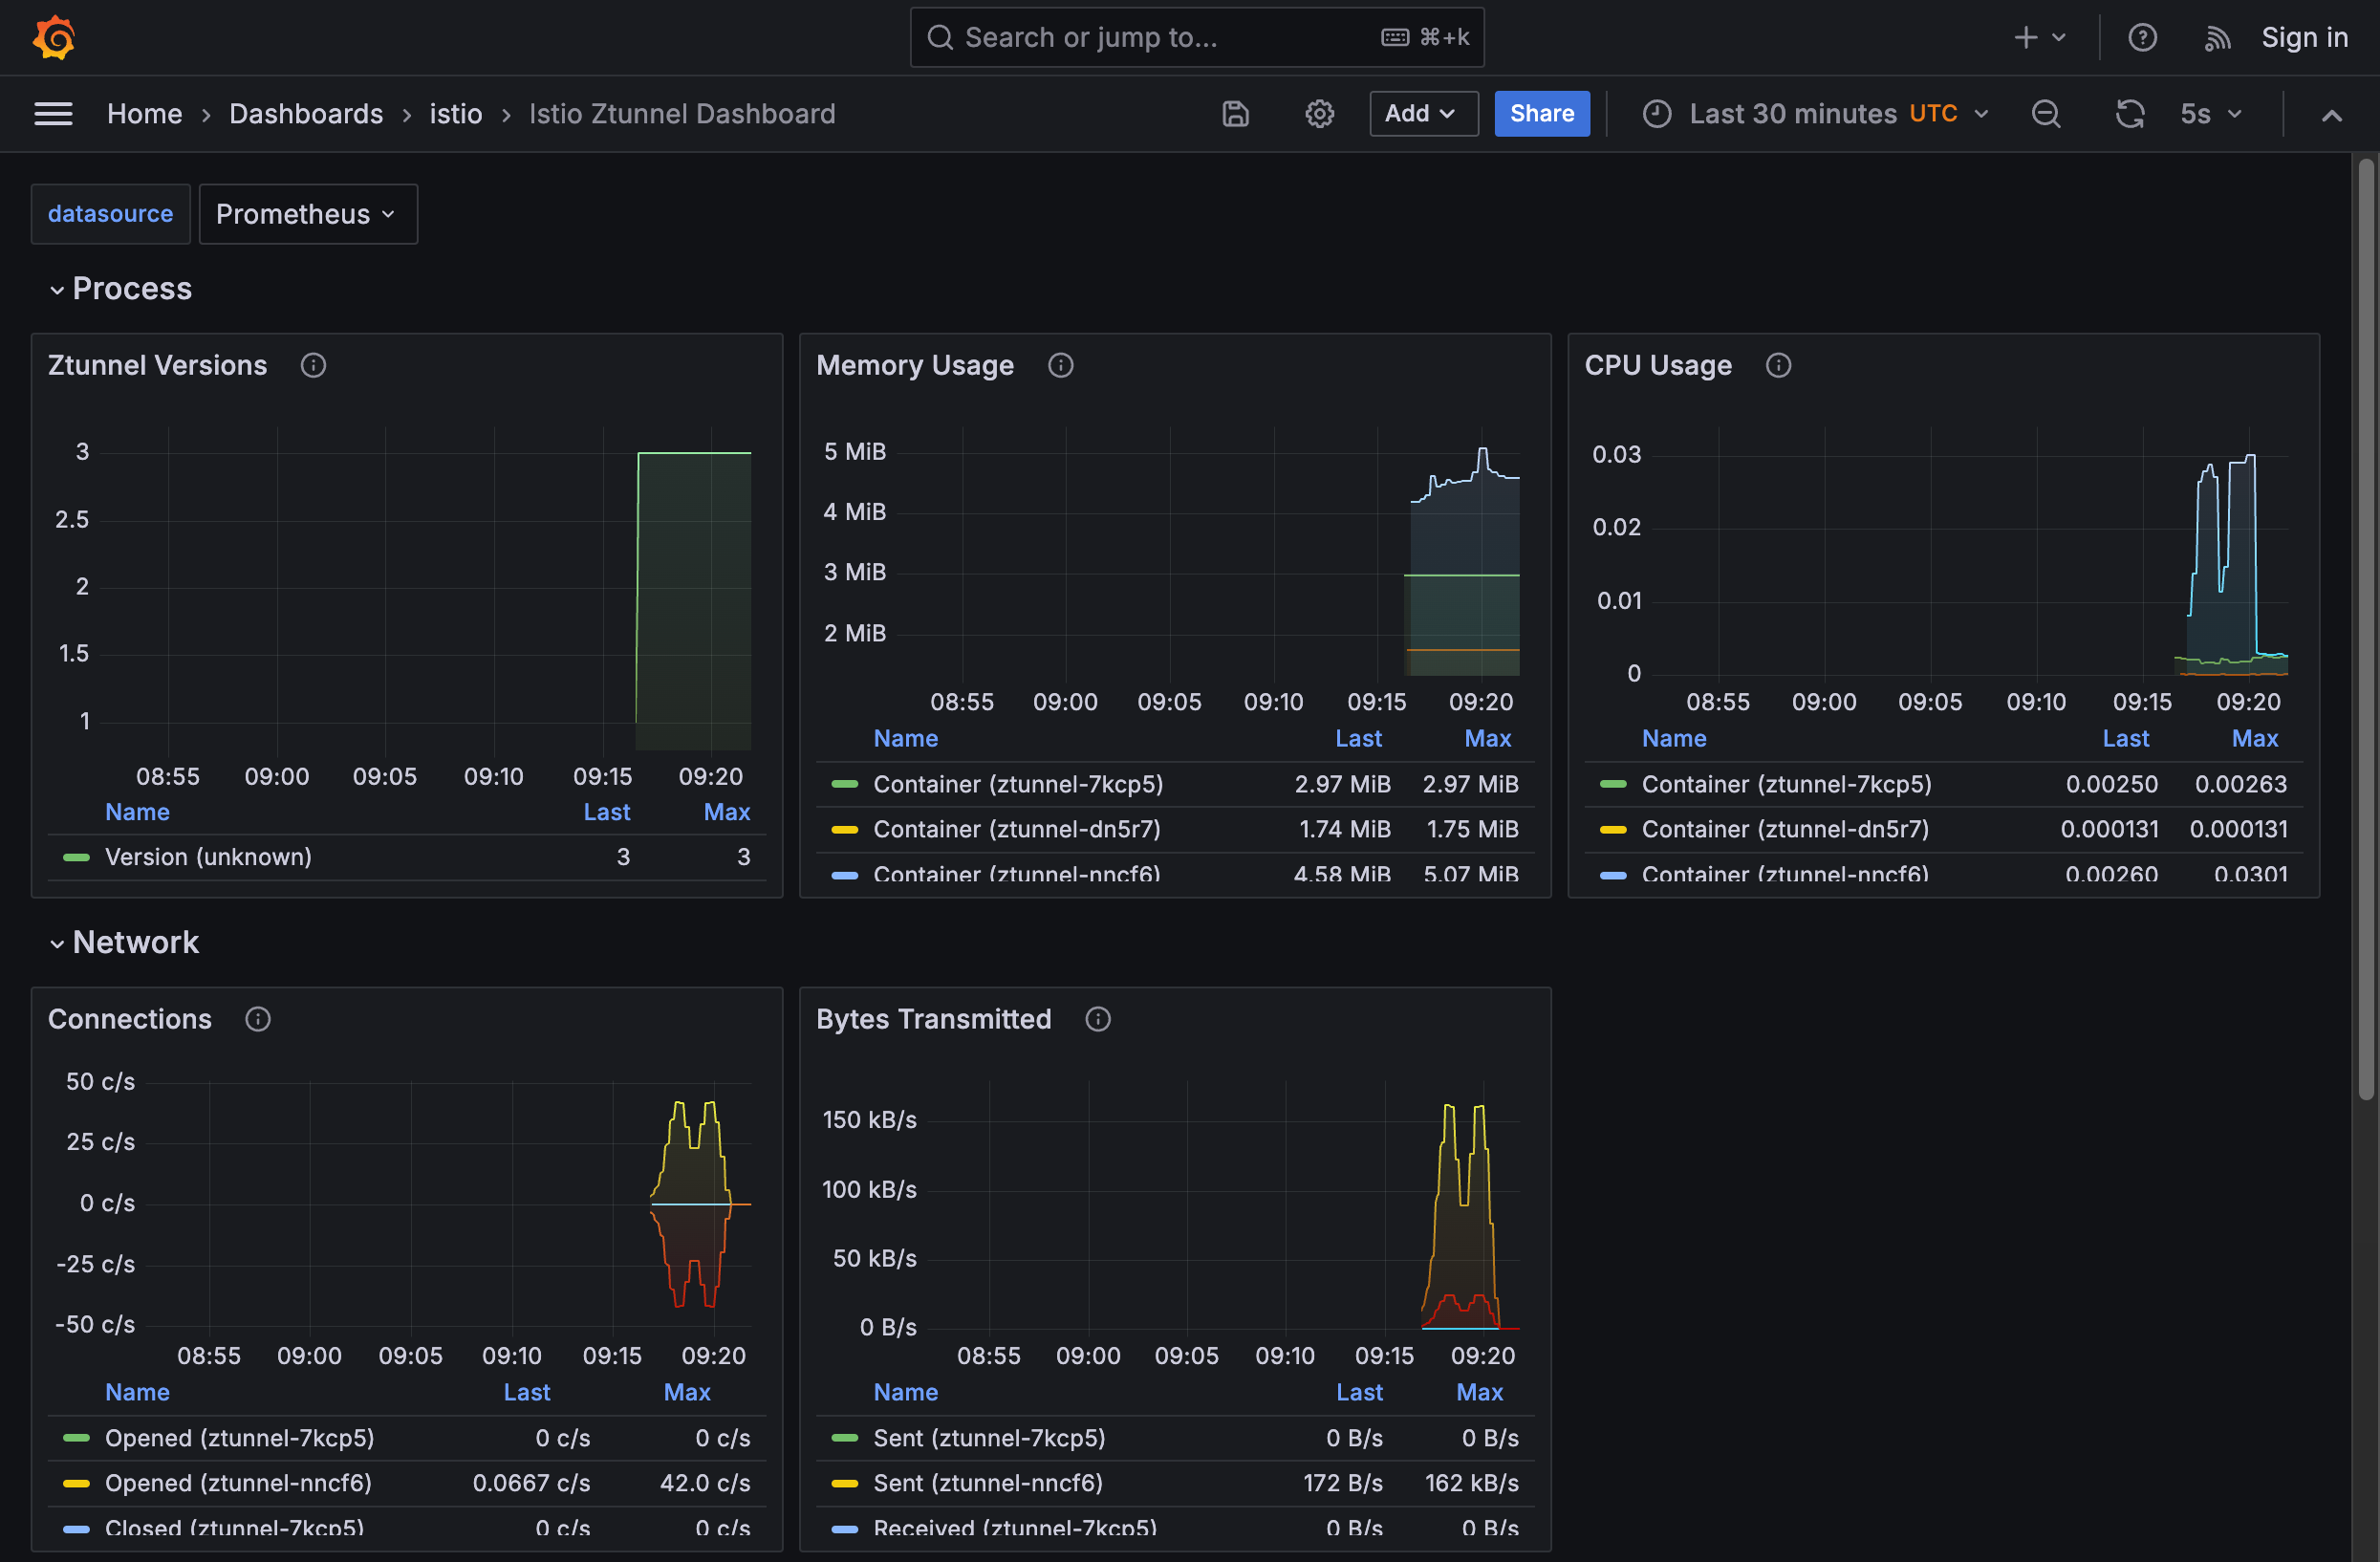
You can also add the dashboards to your own Grafana installation by downloading them from grafana.com.
Differences between the layers
ztunnel
Ztunnel exposes the following sets of metrics:
- TCP metrics from Istio’s standard metrics:
istio_tcp_sent_bytes_total: In a TCP connection, the total number of bytes that are sent in the response.istio_tcp_received_bytes_total: In a TCP connection, the size of total bytes received during the request.istio_tcp_connections_opened_total: The total number of open TCP connections.istio_tcp_connections_closed_total: The total number of closed TCP connections.
- Various DNS and debugging metrics
Solo Enterprise for Istio
When using the Solo distribution of Istio, ztunnel also collects HTTP metrics without requiring waypoint proxies: istio_requests_total and istio_request_duration_milliseconds. For details, see Layer 7 observability.
Example istio_tcp_connections_opened_total metric for ztunnel:
istio_tcp_connections_opened_total{
   reporter="source",
   source_workload="productpage-v1",
   source_canonical_service="productpage",
   source_canonical_revision="v1",
   source_workload_namespace="default",
   source_principal="spiffe://cluster.local/ns/default/sa/bookinfo-productpage",
   source_app="productpage",
   source_version="v1",
   source_cluster="Kubernetes",
   destination_service="reviews.default.svc.cluster.local",
   destination_service_namespace="default",
   destination_service_name="reviews",
   destination_workload="waypoint",
   destination_canonical_service="waypoint",
   destination_canonical_revision="latest",
   destination_workload_namespace="default",
   destination_principal="spiffe://cluster.local/ns/default/sa/waypoint",
   destination_app="waypoint",
   destination_version="latest",
   destination_cluster="Kubernetes",
   request_protocol="tcp",
   response_flags="-",
   connection_security_policy="mutual_tls"
} 1
Waypoint proxies
Waypoint proxies expose the full set of Istio metrics.
An example waypoint metric:
istio_requests_total {
   reporter="waypoint",
   source_workload="productpage-v1",
   source_canonical_service="productpage",
   source_canonical_revision="v1",
   source_workload_namespace="default",
   source_principal="spiffe://cluster.local/ns/default/sa/bookinfo-productpage",
   source_app="productpage",
   source_version="v1",
   source_cluster="Kubernetes",
   destination_workload="details-v1",
   destination_workload_namespace="default",
   destination_principal="spiffe://cluster.local/ns/default/sa/bookinfo-details",
   destination_app="details",
   destination_version="v1",
   destination_service="details.default.svc.cluster.local",
   destination_canonical_service="details",
   destination_canonical_revision="v1",
   destination_service_name="details",
   destination_service_namespace="default",
   destination_cluster="Kubernetes",
   request_protocol="http",
   response_code="200",
   grpc_response_status="",
   response_flags="-",
   connection_security_policy="mutual_tls"
} 1
Waypoint proxies also expose Envoy statistics as metrics.