For the complete documentation index, see llms.txt. Markdown versions of all docs pages are available by appending .md to any docs URL.
Enable tracing
Enable distributed tracing in ambient mesh via waypoint proxies, with step-by-step configuration for OpenTelemetry and Jaeger.
Distributed tracing enables you to monitor and understand behavior by tracking individual requests as they flow through a mesh. Traces help mesh operators understand service dependencies and the sources of latency within their service mesh.
Ambient mesh supports distributed tracing through waypoint proxies. The proxies automatically generate trace spans on behalf of the applications they proxy, requiring only that the applications forward the appropriate request context. In this guide, you configure Jaeger, an open source distributed tracing platform. The steps are largely the same for any other similar platform.
Note
Tracing can be enabled at a gateway, but reporting is only available for the whole request. Distributed tracing is only supported when a workload is enrolled in the waypoint layer.
Step 1: Configure an extension provider
To send traces, you must configure an extension provider in meshConfig. Istio supports OpenTelemetry as well as legacy providers such as Zipkin, Datadog, and Apache SkyWalking.
If you followed the quickstart guide, an OpenTelemetry provider called jaeger-tracing is already configured. If you are installing with Helm, update the meshConfig when installing the istiod chart:
meshConfig:
  extensionProviders:
  - name: jaeger-tracing
    opentelemetry:
      port: 4317
      service: jaeger-collector.istio-system.svc.cluster.local
Step 2: Install Jaeger
Managing a production-scale observability stack is a skill in and of itself. For tracing, options include the Jaeger Operator and various commercial offerings. Istio provides a sample installation of Jaeger for testing purposes:
kubectl apply -f https://raw.githubusercontent.com/istio/istio/1.30.0/samples/addons/jaeger.yamlThis deploys a jaeger-collector service that listens for OpenTelemetry traces via gRPC on port 4317, matching the extension provider configured in Step 1.
Launch the Jaeger dashboard with istioctl:
istioctl dashboard jaegerStep 3: Enable tracing with the Telemetry API
Telemetry policies are attached similarly to routes using the targetRefs field to select a Gateway. You can also customize other options, including setting tags on trace spans.
For production use, most users of distributed tracing want sampling at a rate between 1 and 10%. For testing, set the sampling percentage to 100% to capture all traffic.
-
Enable tracing at the gateway. When requests enter the mesh, a tracing header must be added.
apiVersion: telemetry.istio.io/v1 kind: Telemetry metadata: name: telemetry-gateway namespace: default spec: targetRefs: - kind: Gateway name: bookinfo-gateway group: gateway.networking.k8s.io tracing: - providers: - name: "jaeger-tracing" randomSamplingPercentage: 100 -
Enable tracing at the waypoint. When using waypoints, trace information is captured for services called downstream.
apiVersion: telemetry.istio.io/v1
kind: Telemetry
metadata:
  name: telemetry-waypoints
  namespace: default
spec:
  targetRefs:
  - kind: Gateway
    name: waypoint
    group: gateway.networking.k8s.io
  tracing:
  - providers:
    - name: "jaeger-tracing"
    randomSamplingPercentage: 100
Step 4: View traces
-
Refresh the Bookinfo productpage a few times to generate trace data.
-
Open the Jaeger dashboard. The Service dropdown lists services for which Jaeger has received traces. Select
bookinfo-gateway-istio.defaultand click Find Traces.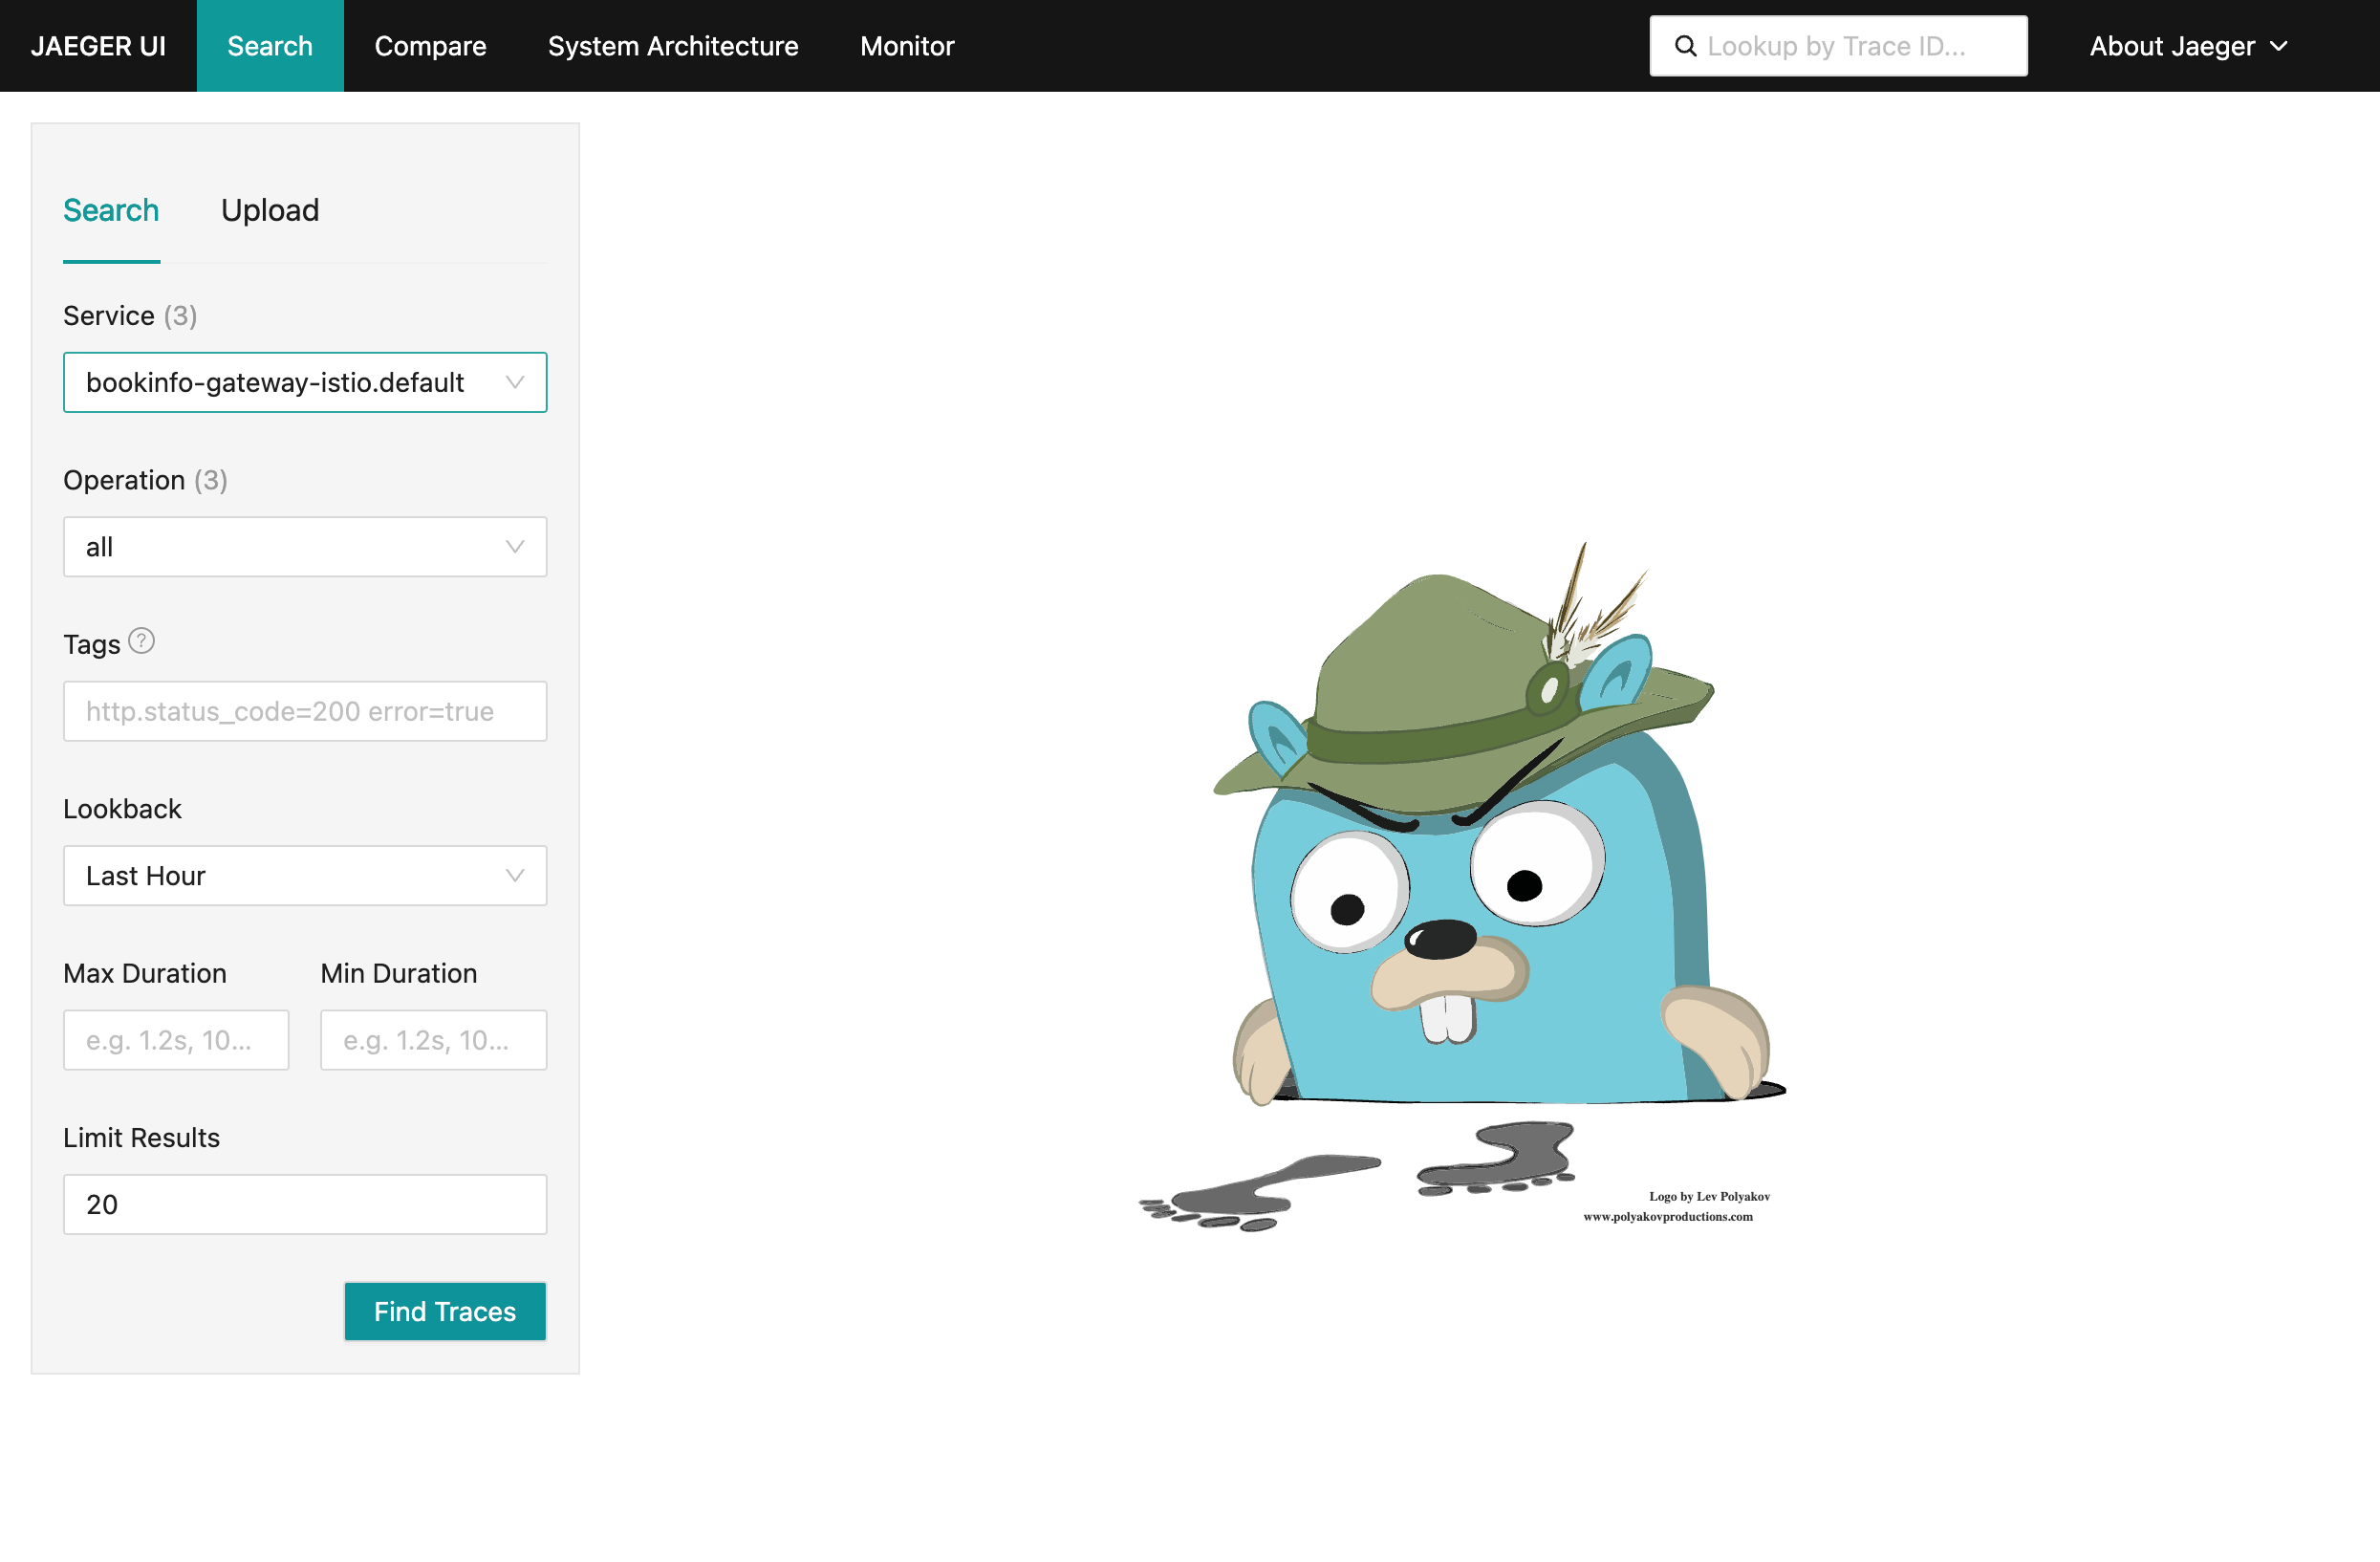
Figure: The Jaeger dashboard Figure: The Jaeger dashboard 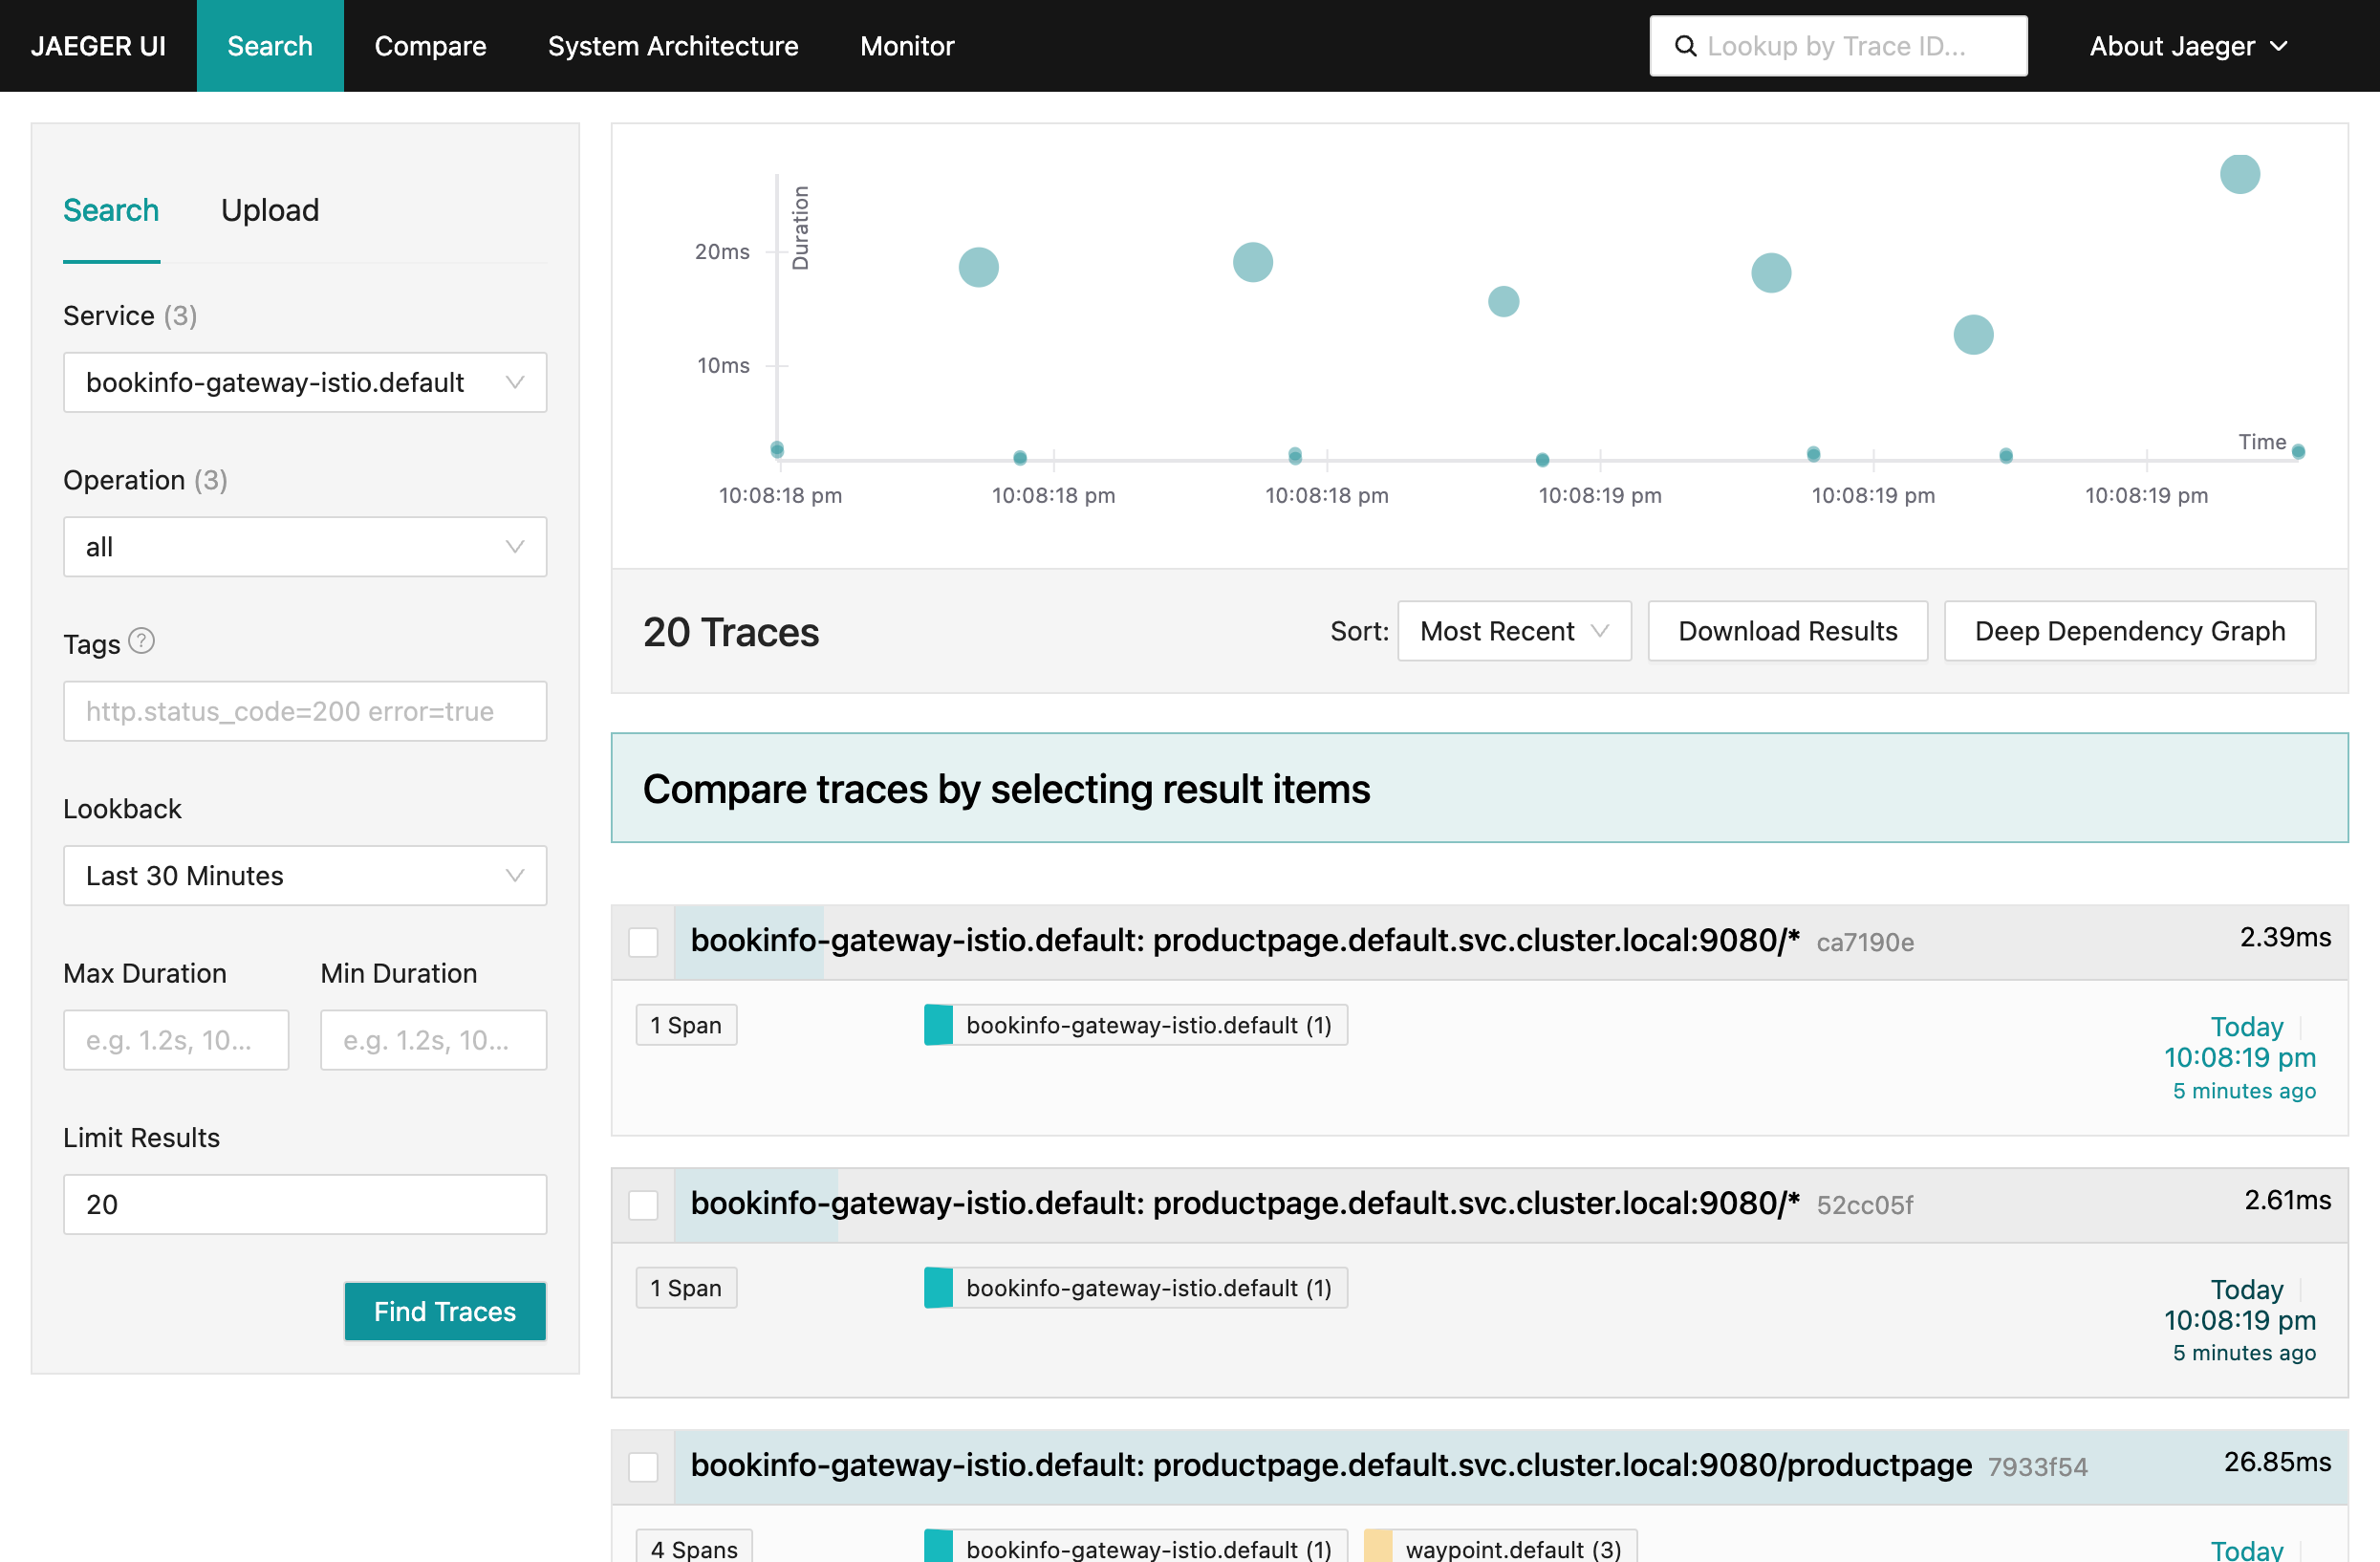
Figure: Captured traces Figure: Captured traces -
Open a trace to inspect it. In this example, two traces exist between the gateway and the productpage service, relating to static files.
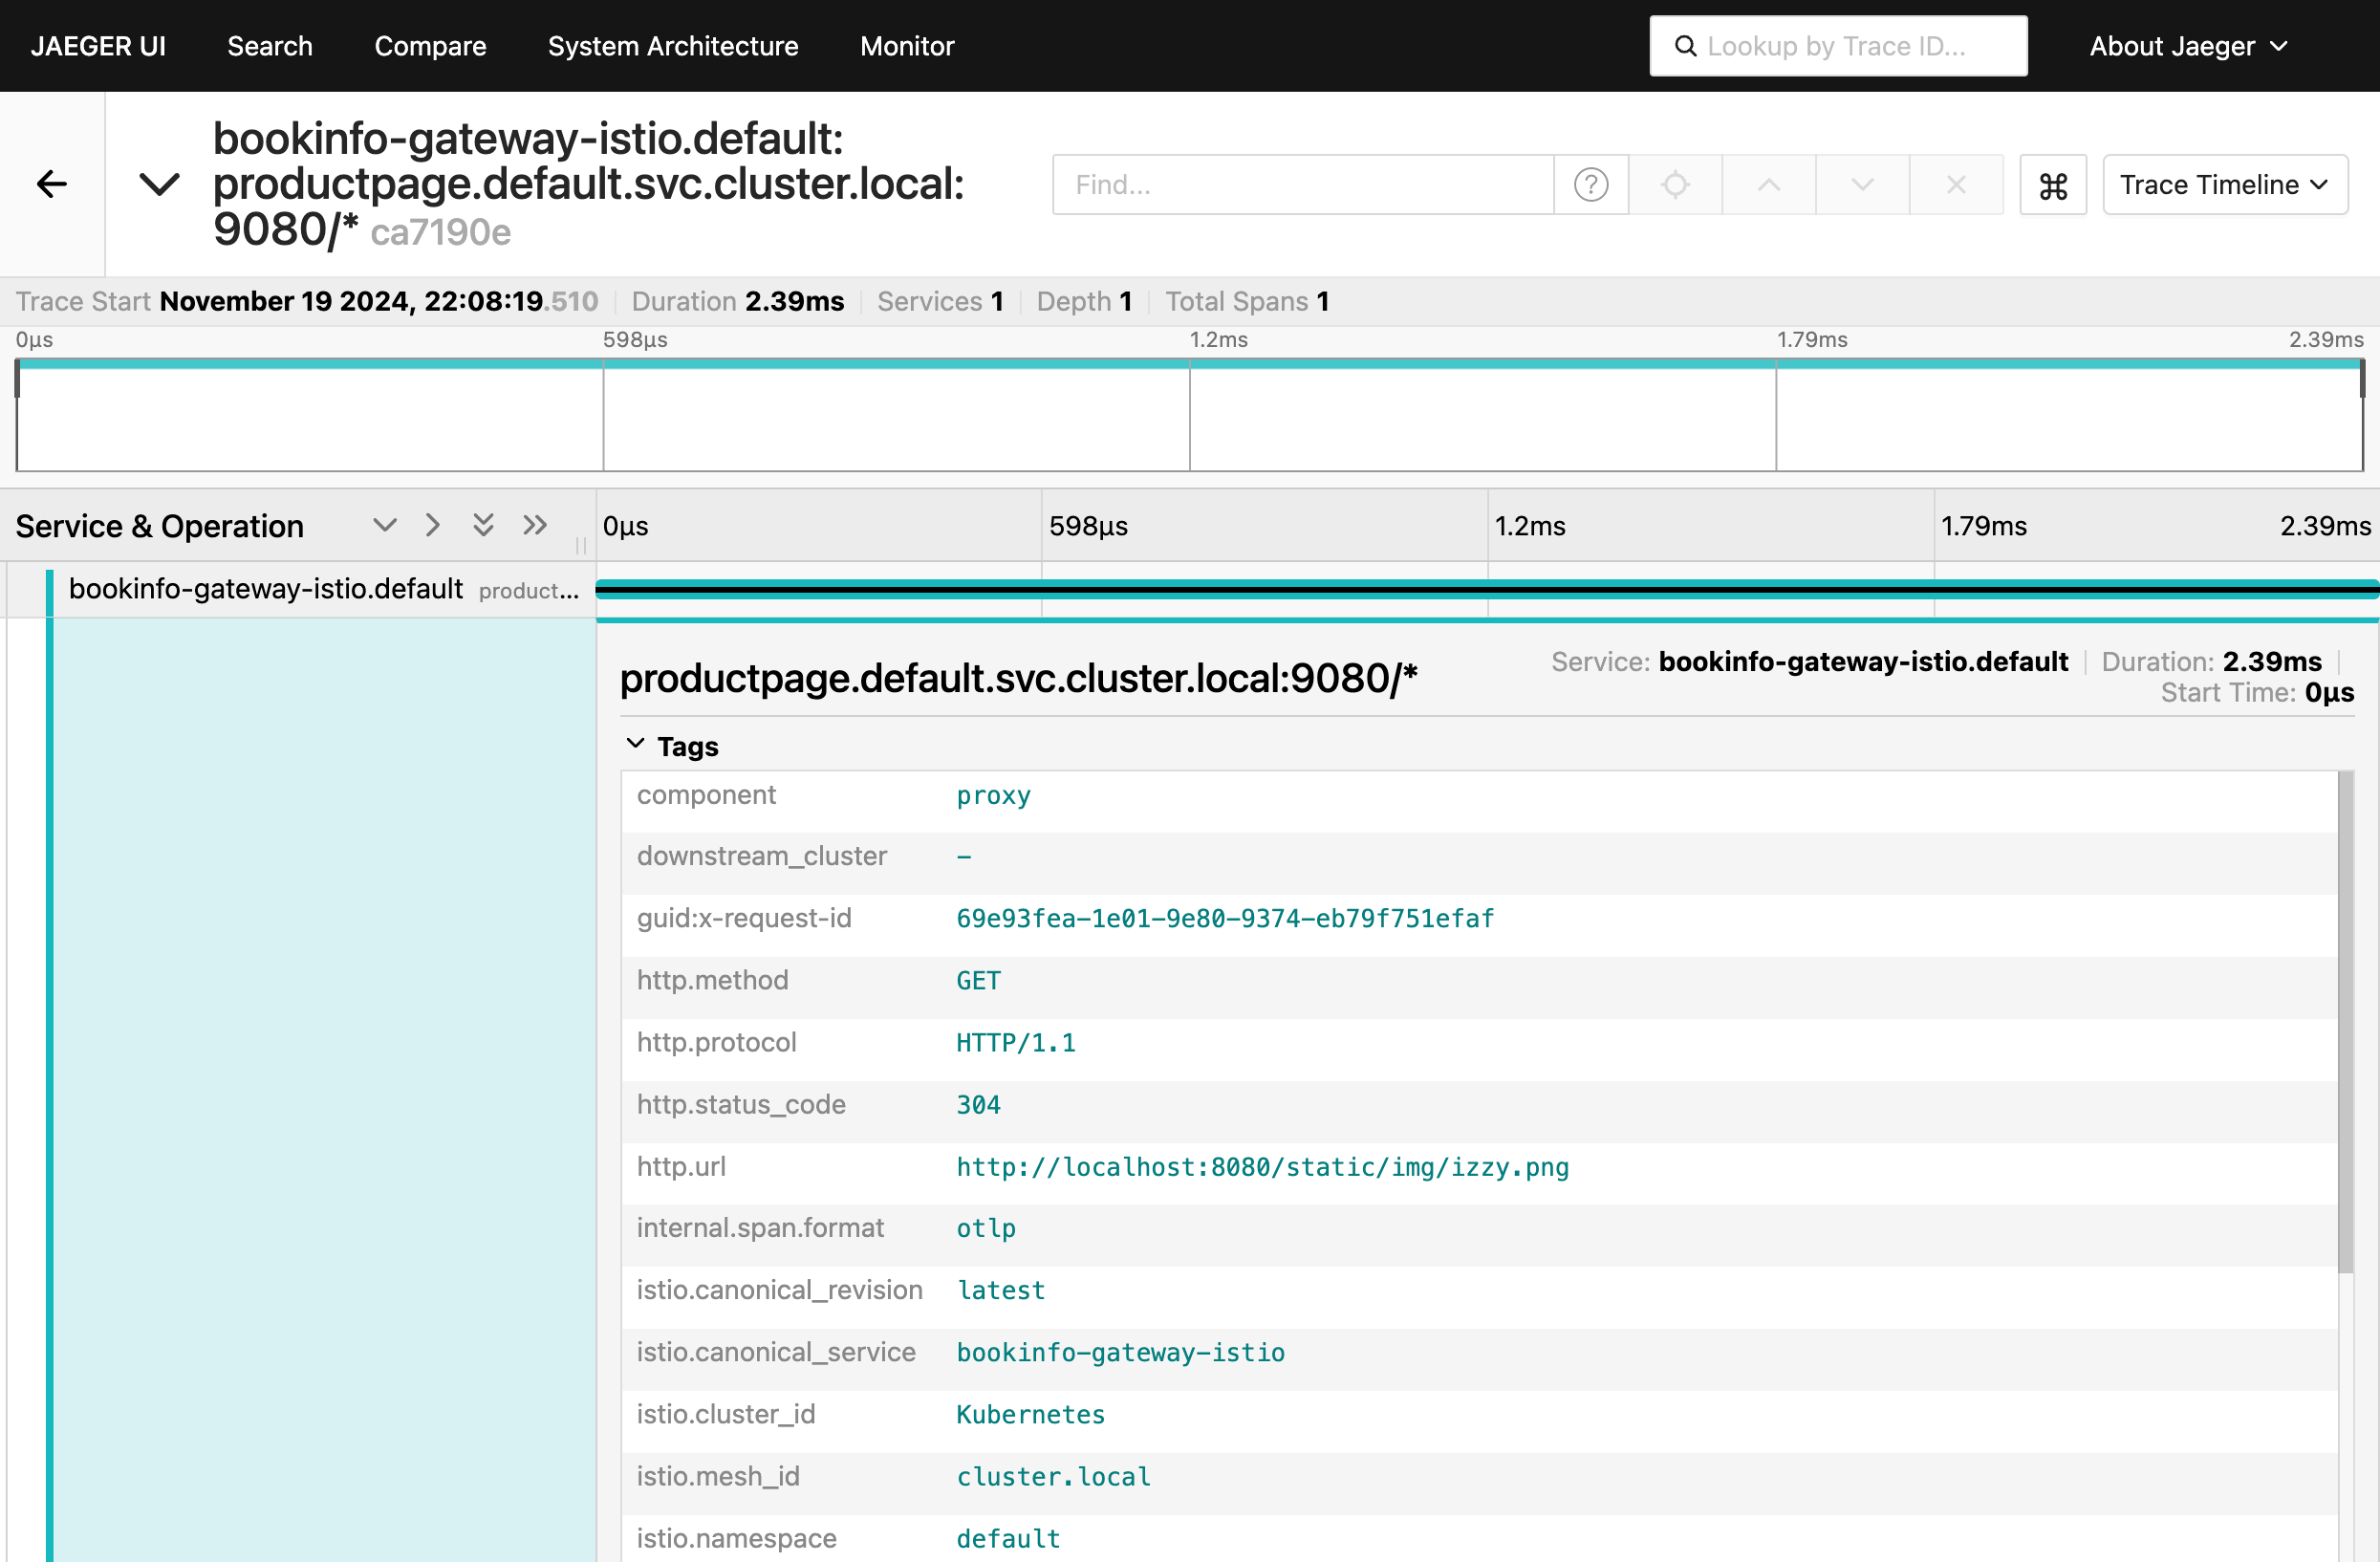
Figure: A trace for izzy.png Figure: A trace for izzy.png -
Review the trace that shows calls from the productpage service as reported by the waypoint proxy. This trace shows that productpage calls details and reviews, and reviews calls ratings.
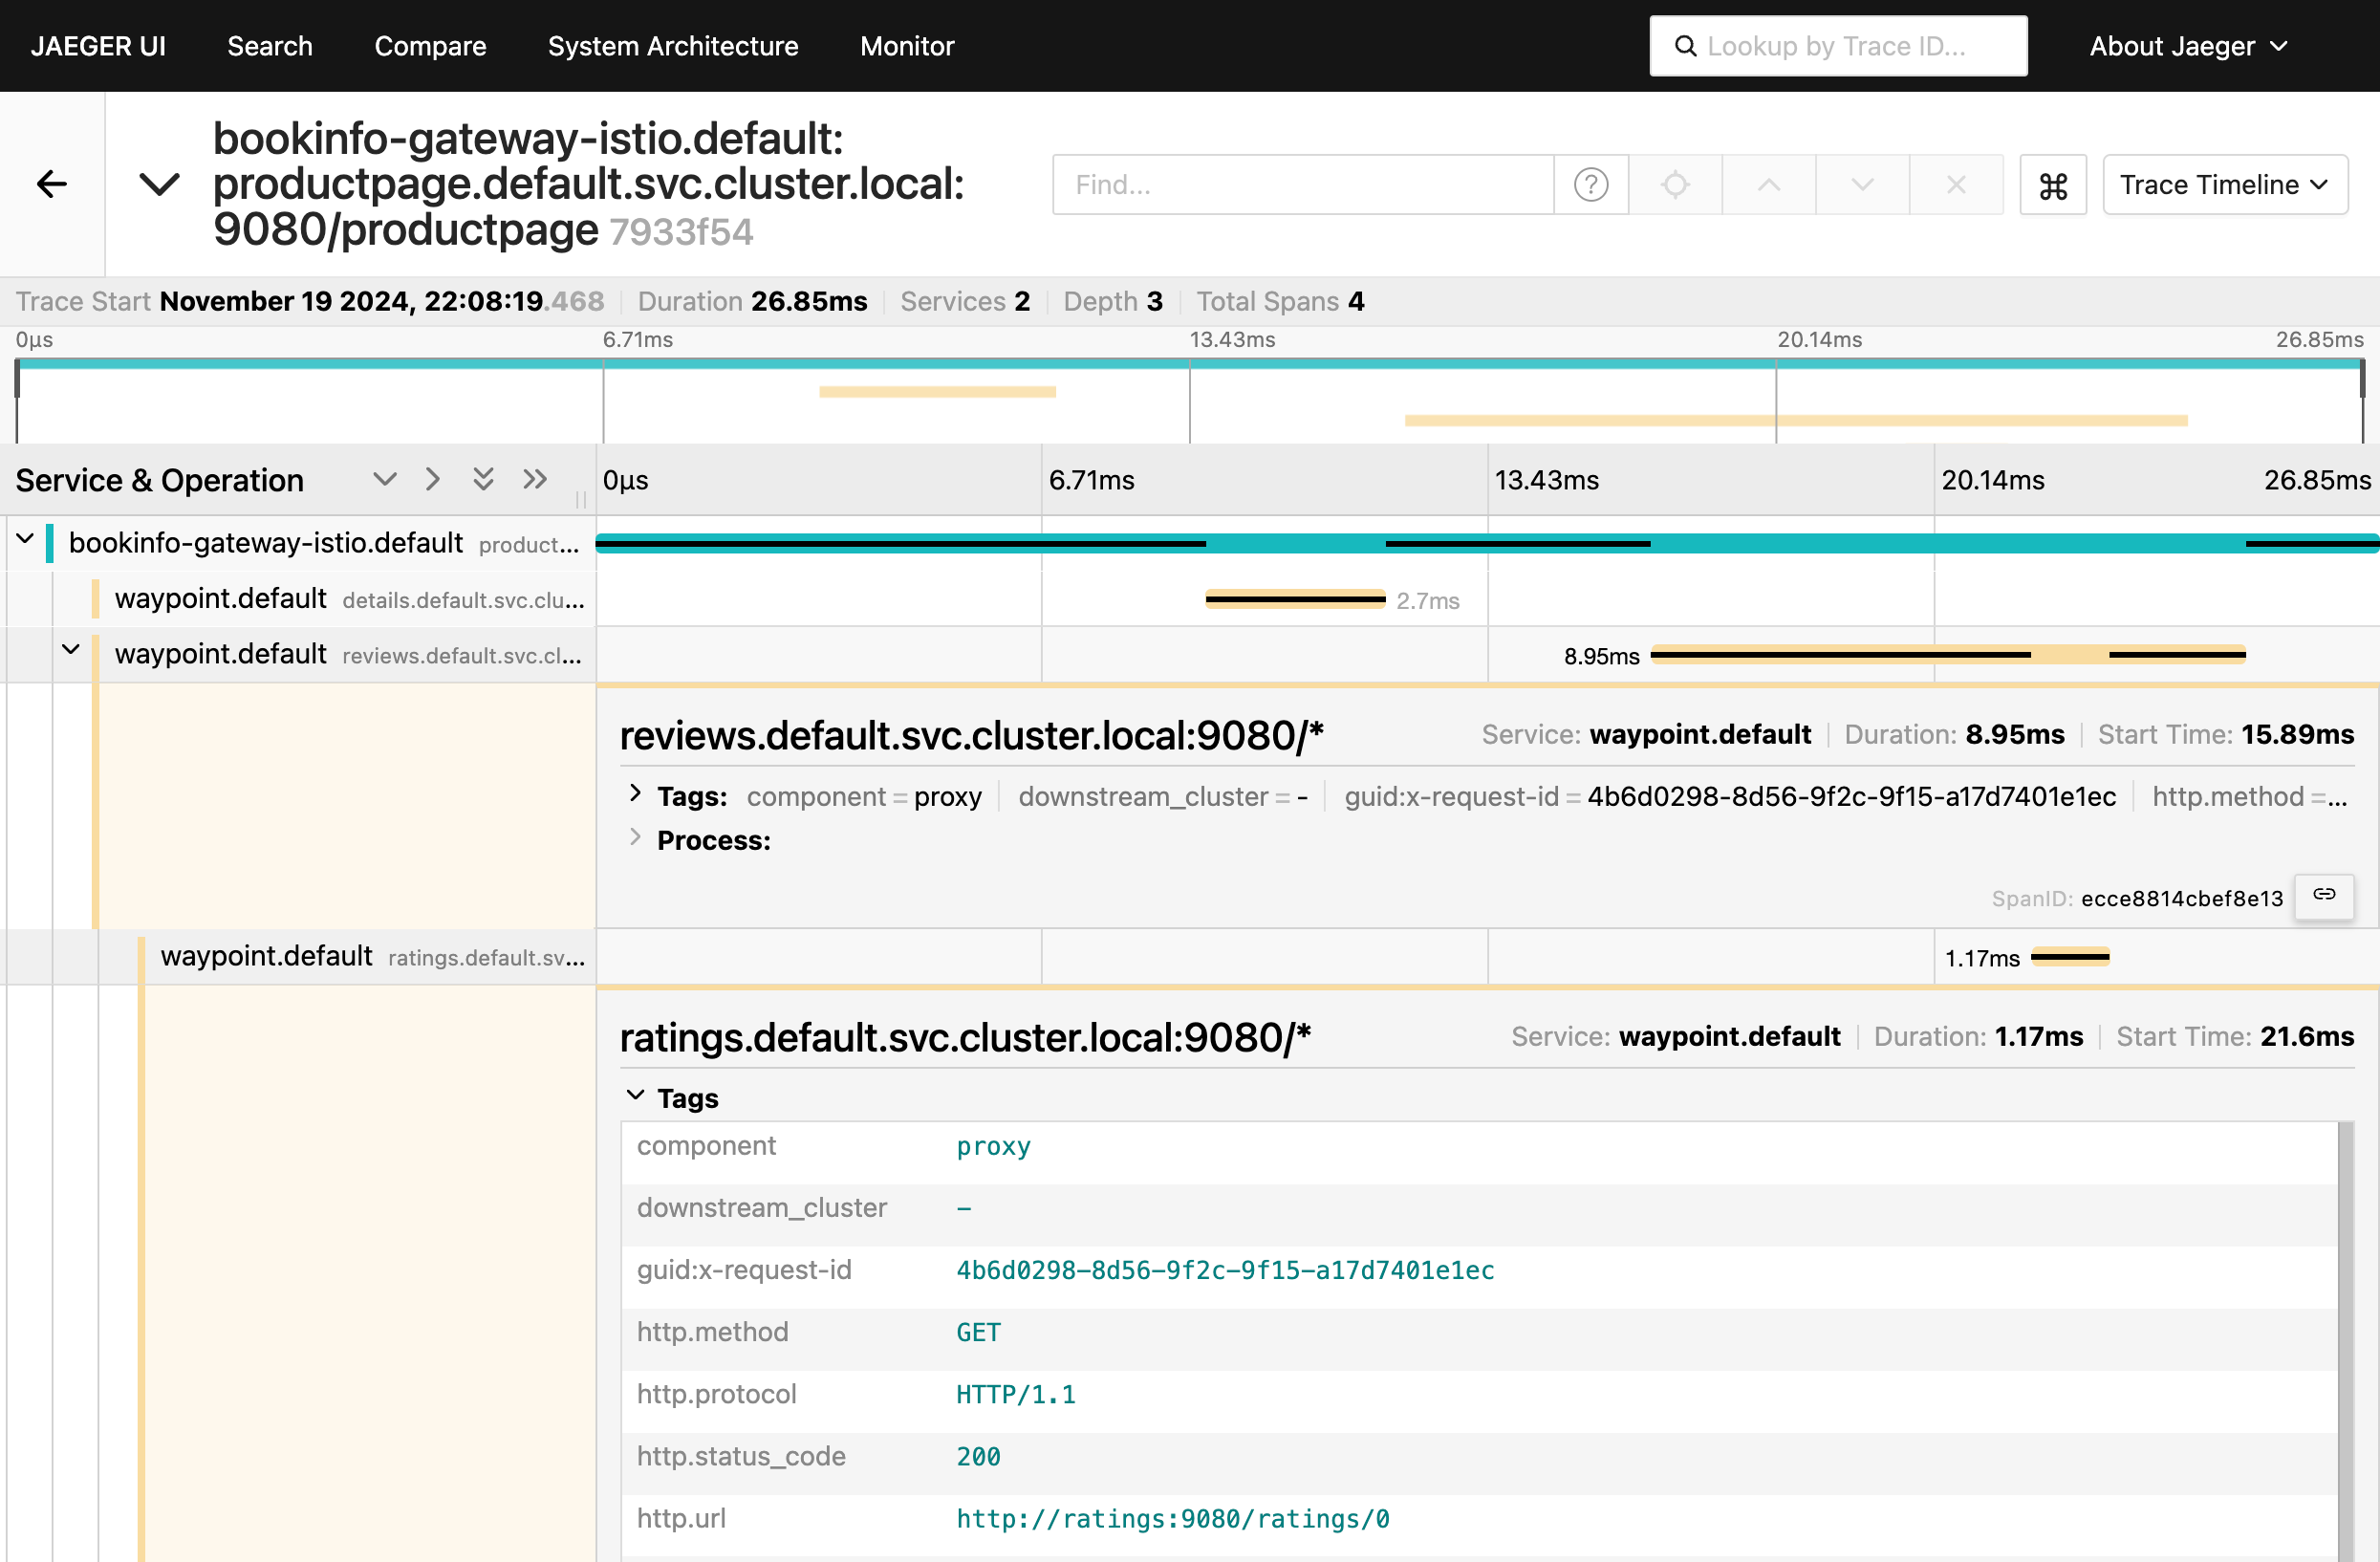
Figure: The services called by productpage Figure: The services called by productpage
Cleanup
Remove the Telemetry objects to disable tracing.
kubectl delete telemetry telemetry-gateway telemetry-waypoints