For the complete documentation index, see llms.txt. Markdown versions of all docs pages are available by appending .md to any docs URL.
Circuit breakers
Limit in-flight connections and requests, rejecting overflow traffic before it can cause cascading failures.
Circuit breaking is a resiliency mechanism that helps prevent cascading failures by limiting how many connections and requests can be in flight to a downstream service at any one time. When the configured thresholds are exceeded, the proxy immediately rejects the excess traffic with a 503 instead of queuing it indefinitely.
Because circuit breaking is implemented between services in the ambient mesh, and the configuration is generally specified by the downstream service owner, it can also be thought of as an implementation of the load shedding pattern.
Note
Istio exposes two related but distinct resiliency mechanisms. This guide covers connection pool limits (connectionPool in a DestinationRule), which correspond to Envoy’s circuit_breakers cluster configuration and enforce overflow thresholds on in-flight connections and requests. The companion mechanism, outlier detection (outlierDetection in a DestinationRule), detects unhealthy hosts based on error rates and ejects them from the load balancing pool. For that health-based ejection pattern, see Outlier detection.
In this guide, you learn how to set up and monitor circuit breakers in your ambient mesh.
Note
Circuit breakers are supported at the edge of a cluster using a gateway, or when a workload is enrolled in the waypoint layer.
Before you begin
-
Label the default namespace to add it to the ambient mesh.
kubectl label ns default istio.io/dataplane-mode=ambient -
Create a waypoint for the default namespace. A waypoint is required because this resiliency feature configures Layer 7 (L7) proxy behavior. For more information on using waypoints, see Configure waypoints.
istioctl waypoint apply -n default --enroll-namespace --wait
Deploy httpbin
-
Deploy the
httpbinservice and two clients:curl, for sending a single request, andfortio, a load testing tool that lets you specify the number of requests and concurrency level.kubectl apply -f https://raw.githubusercontent.com/istio/istio/1.30.0/samples/httpbin/httpbin.yaml kubectl apply -f https://raw.githubusercontent.com/istio/istio/1.30.0/samples/curl/curl.yaml kubectl apply -f https://raw.githubusercontent.com/istio/istio/1.30.0/samples/httpbin/sample-client/fortio-deploy.yaml -
To inspect requests that return a 503 response code in subsequent steps, enable waypoint access logging. By default, waypoint logging is disabled and can be enabled by using Istio’s Telemetry API.
- Enable waypoint access logging by applying a Telemetry resource.
kubectl apply -f - <<EOF apiVersion: telemetry.istio.io/v1 kind: Telemetry metadata: name: enable-access-logging namespace: default spec: accessLogging: - providers: - name: envoy EOF - In one terminal, tail the waypoint’s logs.
kubectl logs --follow deploy/waypoint - In a second terminal, send a test request.
In the output, verify that a log entry similar to the following appears, which confirms that requests traverse the waypoint.
kubectl exec deploy/curl -- curl -s httpbin:8000/get[2026-07-07T17:34:13.930Z] "GET /get HTTP/1.1" 200 - via_upstream - "-" 0 369 3 3 "-" "curl/8.16.0" "c2304c0a-8d65-4450-b1e6-692f736b56e7" "httpbin:8000" "envoy://connect_originate/10.244.0.36:8080" inbound-vip|8000|http|httpbin.default.svc.cluster.local envoy://internal_client_address/ 10.96.103.171:8000 10.244.0.37:60878 - default
Keep the waypoint logs open to refer to them in subsequent steps.
- Enable waypoint access logging by applying a Telemetry resource.
-
Send 100 requests to
httpbinto establish a baseline before configuring circuit breaking.-c 3uses three concurrent threads for requests-qps 0sends the requests as fast as possible-nis the number of requests-quietreduces the output verbosity
kubectl exec deploy/fortio-deploy -- fortio load -c 3 -qps 0 -n 100 -quiet http://httpbin:8000/getIn the output, confirm that all 100 requests return
200.Code 200 : 100 (100.0 %)
Configure circuit breakers
You have two options for circuit breaker configuration:
- Per-service: Apply a
DestinationRuleto configure circuit breaking thresholds for a specific service. Use this approach when different services require different limits. - Mesh-wide default: Set
meshConfig.defaultTrafficPolicyon istiod to apply a baseline circuit breaker policy to all destinations in the mesh. IndividualDestinationRuleresources can override the defaults per service.
Configure per-service circuit breakers
Use a DestinationRule to configure circuit breaking thresholds for a specific service. This approach gives individual service owners control over their own limits and takes precedence over any mesh-wide defaults set in meshConfig.defaultTrafficPolicy.
-
Apply a DestinationRule to configure circuit breaking for
httpbin. A DestinationRule configures post-routing proxy behavior, including circuit breaking thresholds. These thresholds are set artificially low for this example; for production guidance, see the Istio reference documentation.kubectl apply -f - <<EOF apiVersion: networking.istio.io/v1 kind: DestinationRule metadata: name: httpbin spec: host: httpbin.default.svc.cluster.local trafficPolicy: connectionPool: tcp: maxConnections: 1 http: http1MaxPendingRequests: 1 maxRequestsPerConnection: 1 EOF -
Send another 100 requests to trip the circuit breakers. Sending more than a couple of concurrent requests exceeds the artificially low thresholds.
kubectl exec deploy/fortio-deploy -- fortio load -c 3 -qps 0 -n 100 -quiet http://httpbin:8000/getIn the output, note that a percentage of requests return a
503“Service unavailable”.Code 200 : 60 (60.0 %) Code 503 : 40 (40.0 %) -
In the waypoint logs, verify that the
UO(UpstreamOverflow) response flag field is present, which confirms that the circuit breaker tripped and prevented the request from reachinghttpbin.[2026-07-07T17:34:25.767Z] "GET /get HTTP/1.1" 503 UO upstream_reset_before_response_started{overflow} - "-" 0 81 0 - "-" "fortio.org/fortio-1.69.5" "6e74f8d4-7e74-4e6f-8160-d8fbc1c1d164" "httpbin:8000" "-" inbound-vip|8000|http|httpbin.default.svc.cluster.local - 10.96.103.171:8000 10.244.0.38:50118 - default
Configure a global circuit breaker policy
Use meshConfig.defaultTrafficPolicy to set circuit breaker defaults for traffic originating from any workload in the mesh, whether destined for another in-mesh service or an external endpoint. Unlike a per-host DestinationRule, which applies only to a specific service, the global policy applies to every destination, including destinations that are not registered in the service registry.
Per-host DestinationRule resources inherit the mesh-wide defaults and can override individual fields. Fields set in the DestinationRule replace the corresponding defaults; fields not set continue to use the mesh-wide value.
-
Save the following Helm values to a file named
default-traffic-policy.yaml. These thresholds are set artificially low for this example; for production guidance, see the Istio reference documentation.cat > default-traffic-policy.yaml <<EOF meshConfig: defaultTrafficPolicy: connectionPool: tcp: maxConnections: 1 http: http1MaxPendingRequests: 1 maxRequestsPerConnection: 1 EOF -
Upgrade istiod to apply the mesh-wide connection pool settings. In Envoy terms,
connectionPoolmaps to thecircuit_breakerscluster configuration. Requests that exceed these limits are rejected immediately rather than queued or forwarded.helm upgrade istiod istio/istiod \ --namespace istio-system \ --reuse-values \ --values default-traffic-policy.yaml -
Verify that the global policy is applied by checking the istiod mesh config.
kubectl get configmap istio -n istio-system -o jsonpath='{.data.mesh}' | grep -A10 defaultTrafficPolicyExample output:
defaultTrafficPolicy: connectionPool: http: http1MaxPendingRequests: 1 maxRequestsPerConnection: 1 tcp: maxConnections: 1 -
If you applied a per-service
DestinationRuleforhttpbinin the previous section, remove it first. A per-serviceDestinationRuleoverrides the global defaults and would prevent you from observing the global policy in this step.kubectl delete destinationrule httpbin --ignore-not-found -
Send 100 requests to
httpbinto trip the global circuit breaker. Sending more than a couple of concurrent requests exceeds the artificially low thresholds.kubectl exec deploy/fortio-deploy -- fortio load -c 3 -qps 0 -n 100 -quiet http://httpbin:8000/getIn the output, note that a percentage of requests return a
503“Service unavailable”.Code 200 : 60 (60.0 %) Code 503 : 40 (40.0 %) -
In the waypoint logs, verify that the
UO(UpstreamOverflow) response flag field is present, which confirms that the global circuit breaker tripped.[2026-07-07T17:34:25.767Z] "GET /get HTTP/1.1" 503 UO upstream_reset_before_response_started{overflow} - "-" 0 81 0 - "-" "fortio.org/fortio-1.69.5" "6e74f8d4-7e74-4e6f-8160-d8fbc1c1d164" "httpbin:8000" "-" inbound-vip|8000|http|httpbin.default.svc.cluster.local - 10.96.103.171:8000 10.244.0.38:50118 - default
Circuit breaking metrics
By default, Istio configures Envoy to record a minimal set of statistics to reduce overall CPU and memory footprint. Circuit breaker metrics are not included by default, and you must configure Istio to include them in the following steps. After you enable the metrics, overflows are reflected in metrics such as upstream_cx_overflow (connection overflow) and upstream_rq_pending_overflow (request overflow). Two other overflow breaker metrics, the connection pool overflow and retry budget overflow, are available as additional thresholds that are not explored in this guide.
-
Configure circuit breaking metrics collection.
-
Save the following Helm values to a file named
mesh-config.yaml.cat > mesh-config.yaml <<EOF meshConfig: defaultConfig: proxyStatsMatcher: inclusionRegexps: - ".*outlier_detection.*" - ".*upstream_rq_retry.*" - ".*upstream_rq_pending.*" - ".*upstream_cx_.*" inclusionSuffixes: - "upstream_rq_timeout" EOF -
Upgrade the
istiodchart with the updated configuration.helm upgrade istiod istio/istiod \ --namespace istio-system \ --reuse-values \ --values mesh-config.yaml \ --wait -
Restart the waypoint to pick up the updated configuration.
kubectl rollout restart deploy waypoint
-
-
Review metrics by using Prometheus or the Envoy proxy’s admin interface.
-
Deploy Prometheus to the cluster.
kubectl apply -f https://raw.githubusercontent.com/istio/istio/1.30.0/samples/addons/prometheus.yaml -
Connect to the Prometheus dashboard.
istioctl dashboard prometheus -
Query the pending connection overflow metric for
httpbin. Note the current counter value (if you just deployed Prometheus, there may be no result yet).envoy_cluster_upstream_rq_pending_overflow{cluster_name=~".*httpbin.*"}
-
Send 100 more requests to increase the counters.
kubectl exec deploy/fortio-deploy -- fortio load -c 3 -qps 0 -n 100 -quiet http://httpbin:8000/get -
Wait 20 seconds for Prometheus to collect another round of metrics, and then re-run the
envoy_cluster_upstream_rq_pending_overflow{cluster_name=~".*httpbin.*"}query. The counts increase by the same number as the503errors reported by Fortio.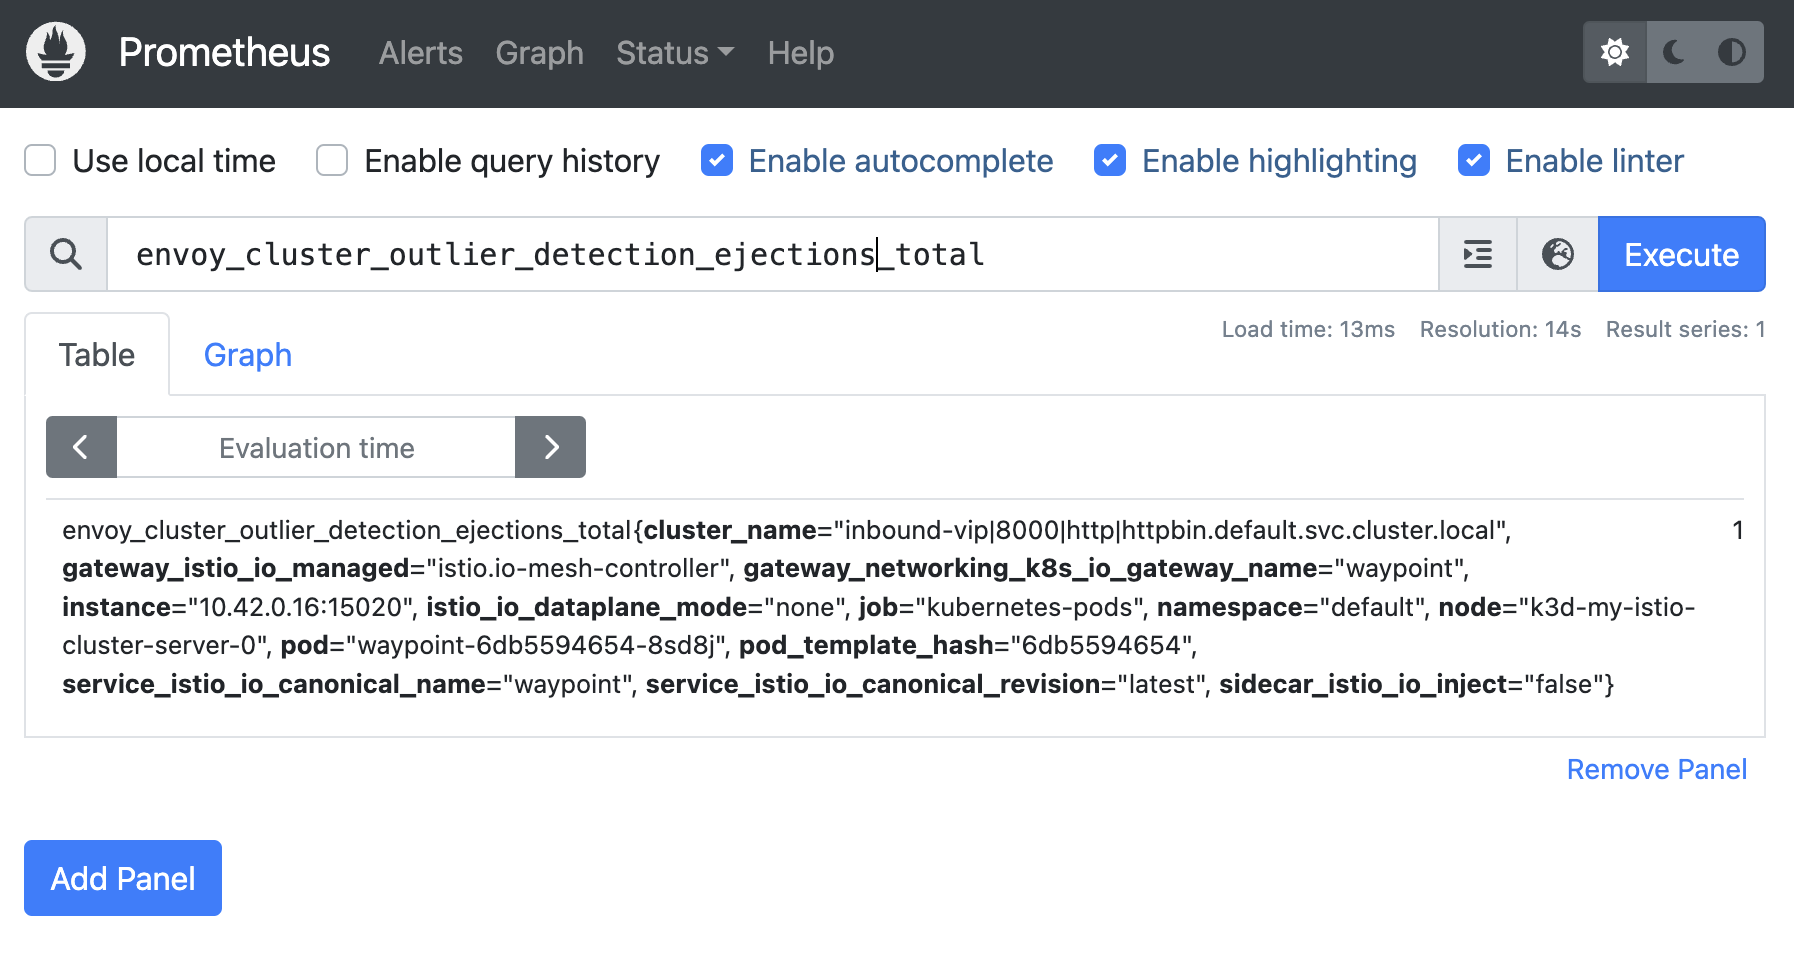
Figure: Pending requests overflow counter metric in Prometheus Figure: Pending requests overflow counter metric in Prometheus
-
Cleanup
-
Delete the sample resources.
kubectl delete -f https://raw.githubusercontent.com/istio/istio/1.30.0/samples/addons/prometheus.yaml kubectl delete destinationrule httpbin istioctl waypoint delete -n default waypoint kubectl delete -f https://raw.githubusercontent.com/istio/istio/1.30.0/samples/httpbin/httpbin.yaml kubectl delete -f https://raw.githubusercontent.com/istio/istio/1.30.0/samples/curl/curl.yaml kubectl delete -f https://raw.githubusercontent.com/istio/istio/1.30.0/samples/httpbin/sample-client/fortio-deploy.yaml -
If you configured a global circuit breaker policy, remove it by setting
meshConfig.defaultTrafficPolicy=null.helm upgrade istiod istio/istiod \ --namespace istio-system \ --reuse-values \ --set 'meshConfig.defaultTrafficPolicy=null'