Outlier detection
Outlier detection is a form of passive health checking. That is, unlike health checks that proactively monitor endpoints, with outlier detection the “checking” is performed in the context of a request.
When the proxy detects that a specific workload is not healthy, it can stop sending it requests, for a specified period. We say the workload is ejected. Configuring outlier detection involves specifying both aspects:
- What constitutes an unhealthy workload. For example, a specific number of consecutive 5xx errors over a specific time window.
- Parameters that govern the ejection algorithm, including the ejection duration, and conditions that override a decision to perform an ejection. For example, if too few instances remain in the load balancing pool.
In the following scenario, you will explore a simple example whereby a single replica is ejected, to make things easy to test. The subsequent fault injection scenario provides a second, more realistic example involving multiple replicas.
Setup
Set up a cluster
You should have a running Kubernetes cluster with Istio installed in ambient mode. Ensure your default namespace is added to the ambient mesh:
$ kubectl label ns default istio.io/dataplane-mode=ambientDeploy a waypoint
If you don’t already have a waypoint installed for the default namespace, install one:
$ istioctl waypoint apply -n default --enroll-namespace --waitFor more information on using waypoints, see Configuring waypoint proxies.
Turn on waypoint logging
Waypoint access logging is off by default, and can be turned on using Istio’s Telemetry API.
So that you can inspect the logs and see requests returning a 503 response code, turn on logging for the waypoint:
$ kubectl apply -f - <<EOF
---
apiVersion: telemetry.istio.io/v1
kind: Telemetry
metadata:
  name: enable-access-logging
  namespace: default
spec:
  accessLogging:
    - providers:
      - name: envoy
EOF
Deploy sample services
To test outlier detection, you will deploy a service, httpbin, and a curl client.
$ kubectl apply -f https://raw.githubusercontent.com/istio/istio/release-1.26/samples/httpbin/httpbin.yaml
$ kubectl apply -f https://raw.githubusercontent.com/istio/istio/release-1.26/samples/curl/curl.yaml
Configure outlier detection
There are two main aspects to configuring outlier detection:
- How to tell when a workload is considered unhealthy
- How long should the workload be quarantined
Outlier detection uses the term “ejection” to indicate the removal of a workload from the pool of load-balancing endpoints that a waypoint uses. The ejection time follows an algorithm based on a “base” ejection time, and a multiplier, which is increased or decreased as a function of the health of the application.
Configuration of outlier detection is done in a DestinationRule.
Specify the threshold for considering a workload unhealthy to be three consecutive 500 (5xx) errors, and set the base ejection time to 15 seconds:
$ kubectl apply -f - <<EOF
apiVersion: networking.istio.io/v1
kind: DestinationRule
metadata:
  name: httpbin
spec:
  host: httpbin
  trafficPolicy:
    outlierDetection:
      consecutive5xxErrors: 3
      baseEjectionTime: 15s
      maxEjectionPercent: 100
EOFmaxEjectionPercent to 100 to support a demo scenario, whereby a single deployed replica can be ejected, even though it constitutes 100% of the workloads backing the httpbin service — something you probably do not want to do in a production setting.The feature can be tested by calling a failing endpoint three times in succession to trigger ejection.
Test outlier detection
In one terminal, tail the waypoint’s logs:
$ kubectl logs --follow deploy/waypointIn a second terminal, run the below commands, and confirm each assertion:
-
A call to
httpbinshould succeed (no failures, no ejections yet):$ kubectl exec deploy/curl -- curl -s httpbin:8000/json -
Trigger ejection by sending three consecutive failing calls:
$ for i in {1..3}; do kubectl exec deploy/curl -- curl -s httpbin:8000/status/500; doneA call to
httpbinshould fail, assuming the request is sent within ejection period (15s):$ kubectl exec deploy/curl -- curl -s httpbin:8000/jsonNote the
UHresponse flag (No Healthy Upstream) in the logs:[2024-12-07T22:17:20.424Z] "GET /json HTTP/1.1" 503 UH no_healthy_upstream - "-" 0 19 0 - "-" "curl/8.11.0" "fd944d8d-d8fb-4aa7-a0b8-1941dd467af9" "httpbin:8000" "-" inbound-vip|8000|http|httpbin.default.svc.cluster.local - 10.43.203.172:8000 10.42.0.9:34678 - defaultThe same message is shown in the response:
no healthy upstreamThis is validation that our lone workload has been ejected, since no endpoints remain in the proxy’s load balancing pool.
-
A call to
httpbinshould succeed after ejection time elapses (wait > 15s):$ kubectl exec deploy/curl -- curl -s httpbin:8000/json
Triggering more ejections on the workload will cause a multiplier to increase, and ejection times will increase. Similarly, after a period of the workload remaining healthy, the multiplier will decrease.
Configure metrics collection
By default, Istio configures Envoy to record a minimal set of statistics to reduce the overall CPU and memory footprint. Outlier detection metrics are not included by default, and you must configure Istio to include them.
Using a Helm values file to configure Istio’s global mesh settings, you can include metrics that pertain to circuit breaking and outlier detection:
---
meshConfig:
  defaultConfig:
    # enable stats for circuit breakers, request retries, upstream connections, and request timeouts globally:
    proxyStatsMatcher:
      inclusionRegexps:
        - ".*outlier_detection.*"
        - ".*upstream_rq_retry.*"
        - ".*upstream_rq_pending.*"
        - ".*upstream_cx_.*"
      inclusionSuffixes:
        - "upstream_rq_timeout"
Save the above content to a file named mesh-config.yaml.
To configure metrics collection, run the helm upgrade command for the istiod chart, providing the additional configuration file as an argument:
$ helm upgrade istiod istio/istiod --namespace istio-system \
  --set profile=ambient \
  --values mesh-config.yaml \
  --wait
The waypoint must then be restarted in order to pick up the updated configuration:
$ kubectl rollout restart deploy waypointYou are ready to observe some metrics.
Deploy Prometheus and display the metrics
Deploy Prometheus to the cluster:
$ kubectl apply -f https://raw.githubusercontent.com/istio/istio/release-1.26/samples/addons/prometheus.yamlSee Configure and view metrics for more information on configuring and viewing metrics.
Once Prometheus is deployed and ready, connect to its dashboard:
$ istioctl dashboard prometheusLook for metrics such as envoy_cluster_outlier_detection_ejections_enforced_total and envoy_cluster_outlier_detection_ejections_enforced_consecutive_5xx.
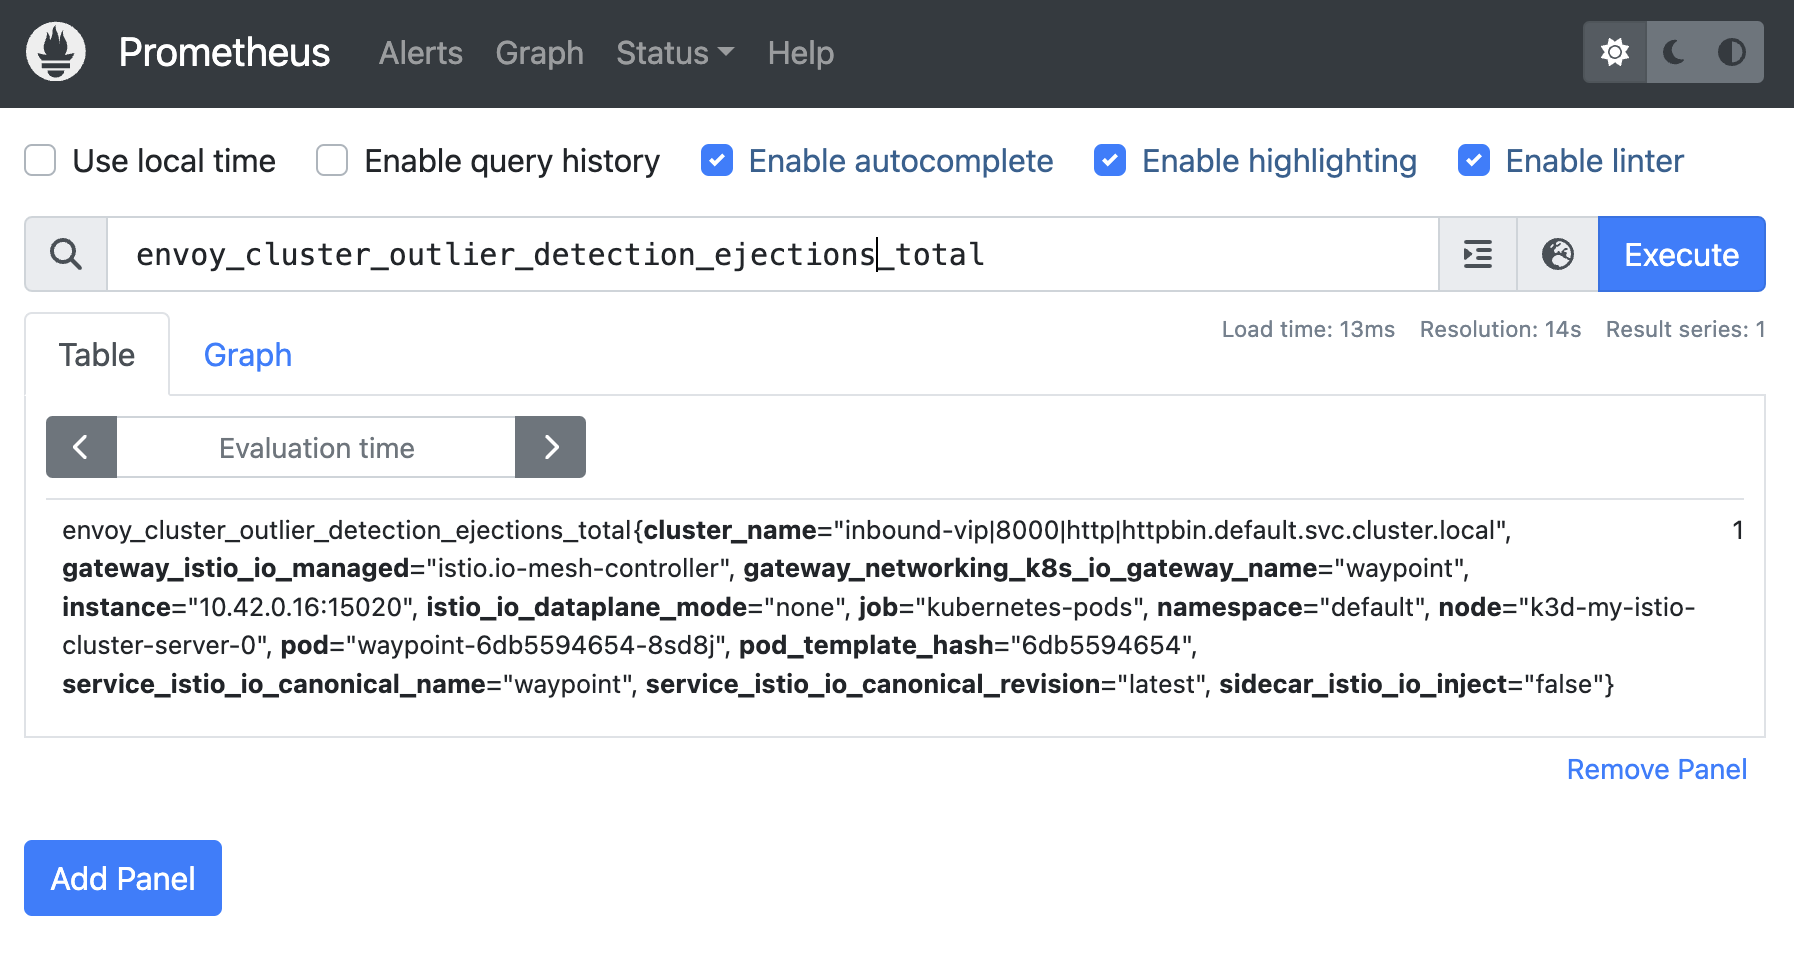
Outlier detection - total ejections counter
Through these and other outlier-detection related metrics, development teams can be kept aware of ejections, a possible indication of issues with their applications.
Outlier detection events
Envoy can be configured to log outlier-detection specific events.
In Istio, use the helm configuration field global.proxy.outlierLogPath (set to, say, /dev/stdout) to turn on the feature.
Below are some example messages showing an ejection event caused by consecutive 500-type errors, and a subsequent corresponding “uneject” event returning the workload to the pool:
{
  "type": "CONSECUTIVE_5XX",
  "timestamp": "2024-12-07T19:30:13.724Z",
  "cluster_name": "inbound-vip|8000|http|httpbin.default.svc.cluster.local",
  "upstream_url": "envoy://connect_originate/10.42.0.8:8080",
  "action": "EJECT",
  "num_ejections": 1,
  "enforced": true,
  "eject_consecutive_event": {}
}
{
  "type": "CONSECUTIVE_5XX",
  "timestamp": "2024-12-07T19:30:37.384Z",
  "secs_since_last_action": "23",
  "cluster_name": "inbound-vip|8000|http|httpbin.default.svc.cluster.local",
  "upstream_url": "envoy://connect_originate/10.42.0.8:8080",
  "action": "UNEJECT",
  "num_ejections": 1,
  "enforced": false
}
Clean up
Delete the Prometheus deployment:
$ kubectl delete -f https://raw.githubusercontent.com/istio/istio/release-1.26/samples/addons/prometheus.yamlDelete the DestinationRule:
$ kubectl delete destinationrule httpbinDeprovision the waypoint:
$ istioctl waypoint delete -n default waypointDeprovision the sample applications:
$ kubectl delete -f https://raw.githubusercontent.com/istio/istio/release-1.26/samples/httpbin/httpbin.yaml
$ kubectl delete -f https://raw.githubusercontent.com/istio/istio/release-1.26/samples/curl/curl.yaml